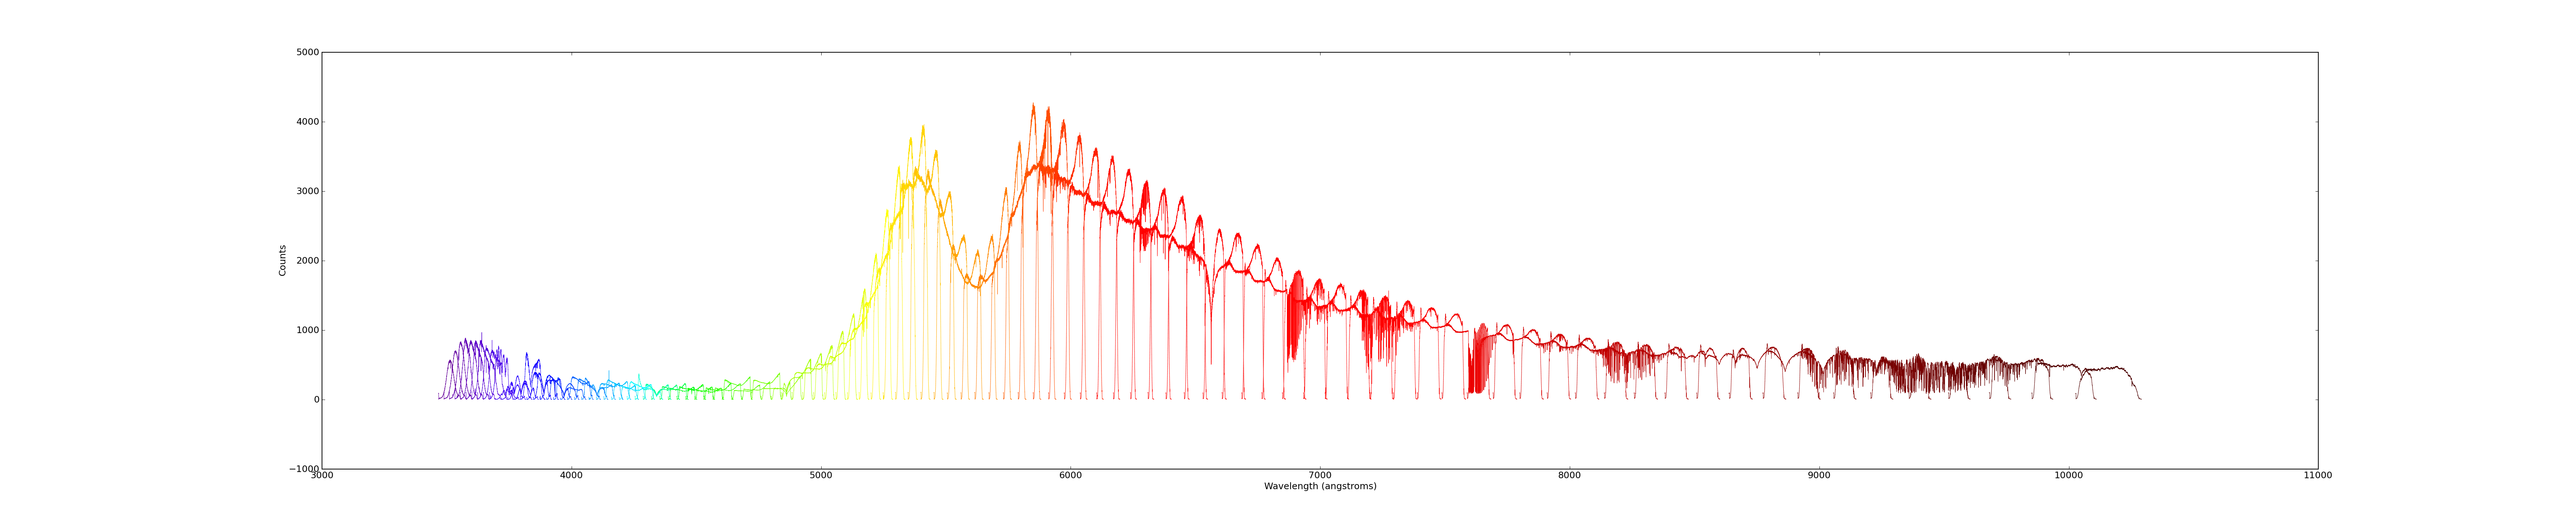
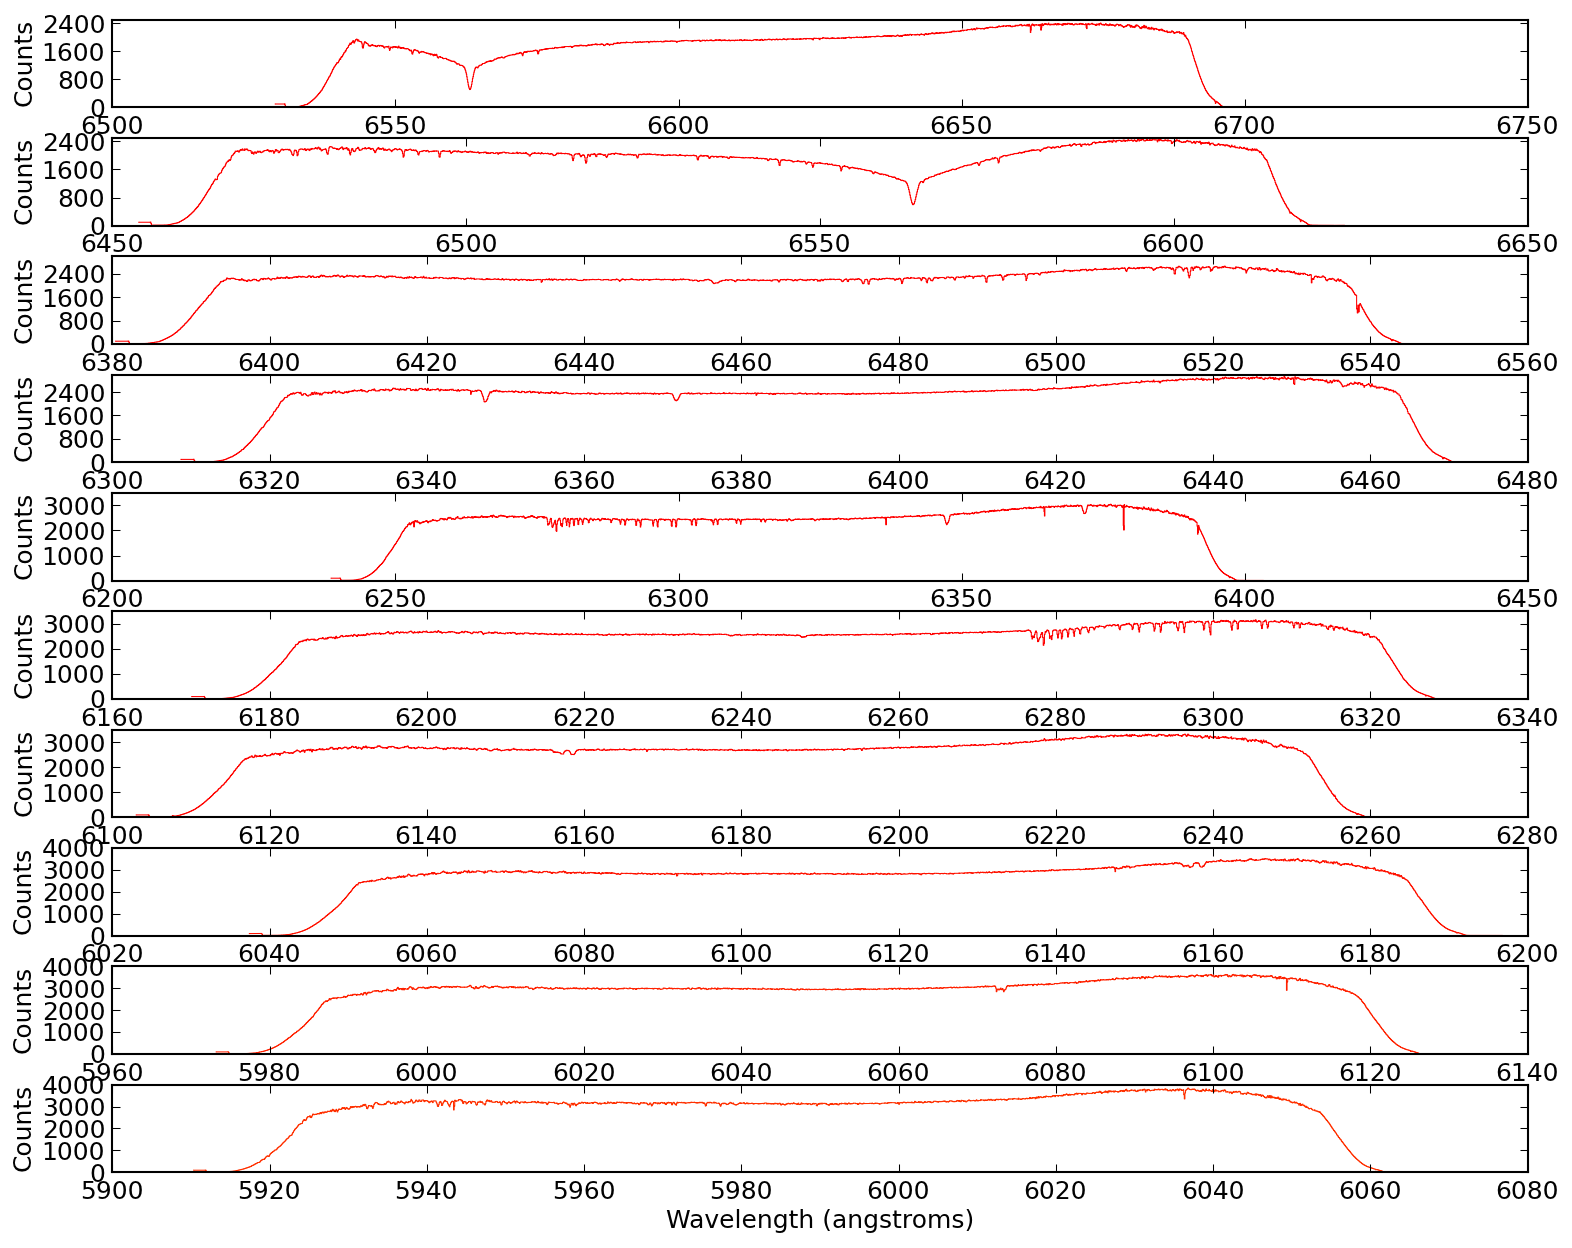
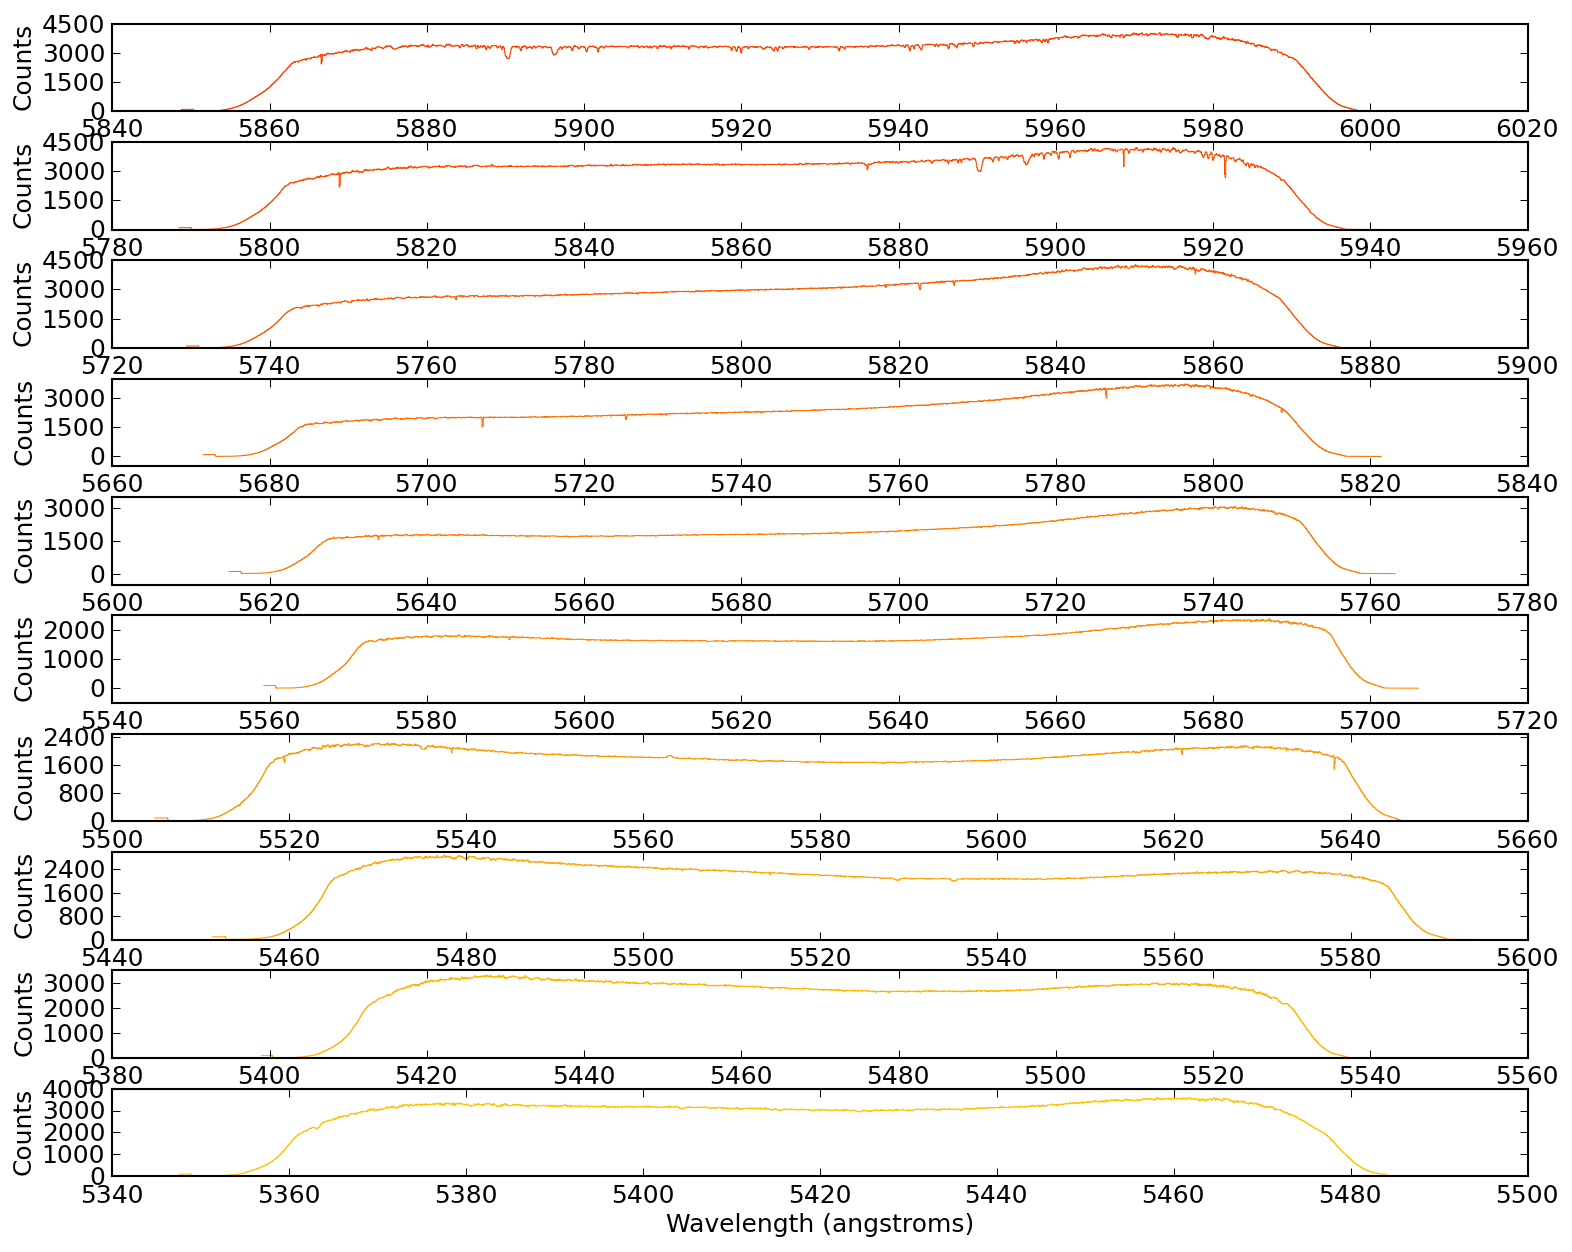
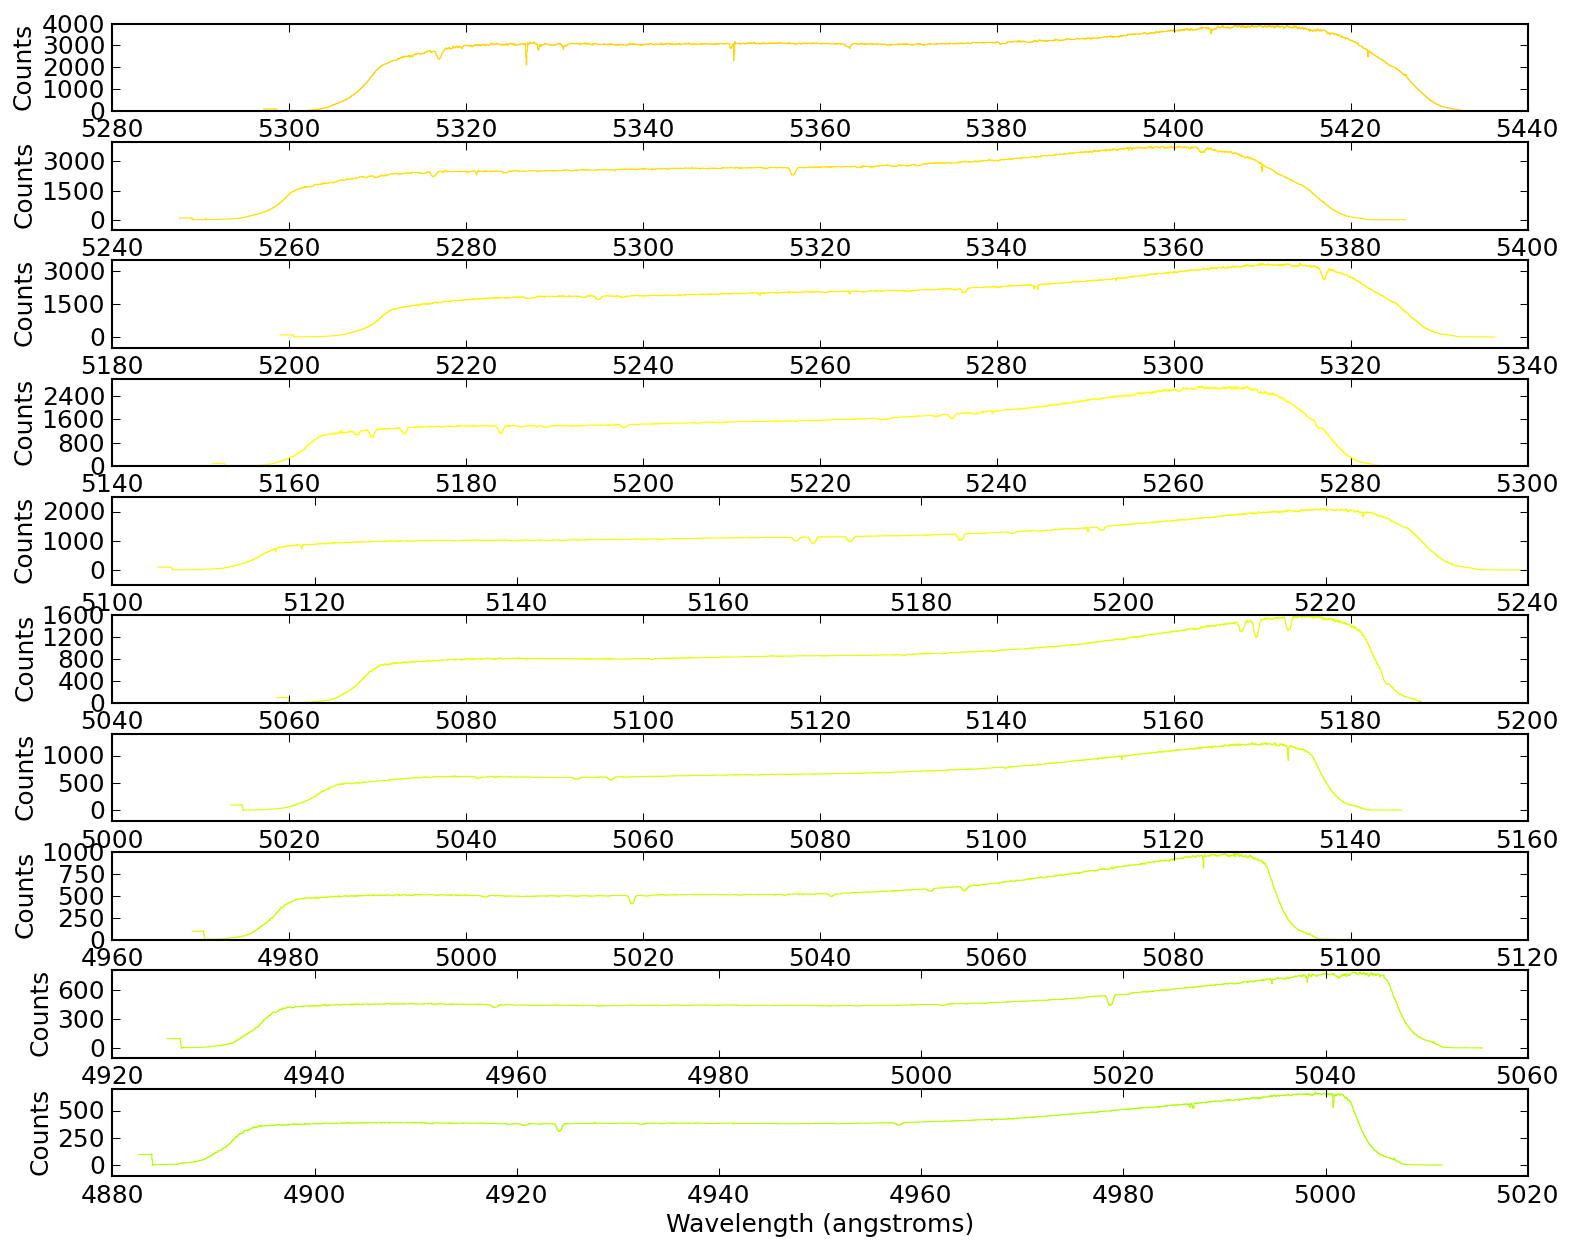
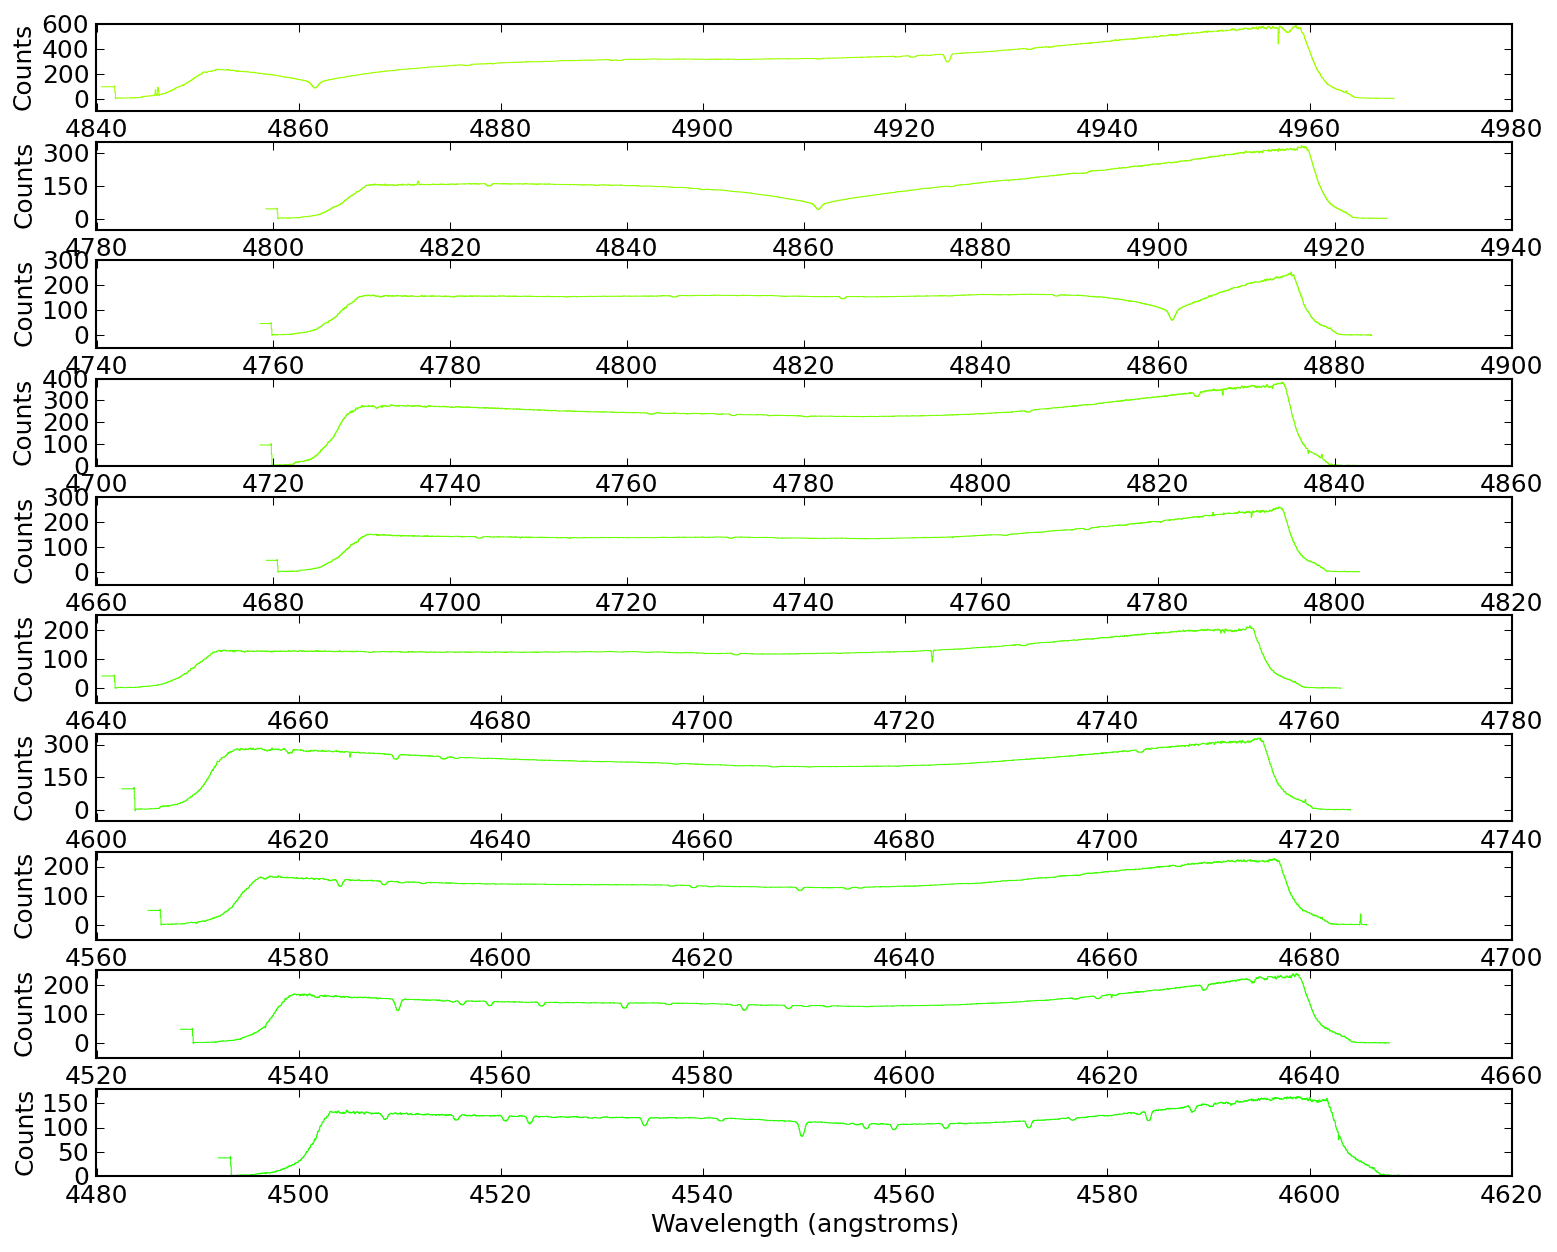
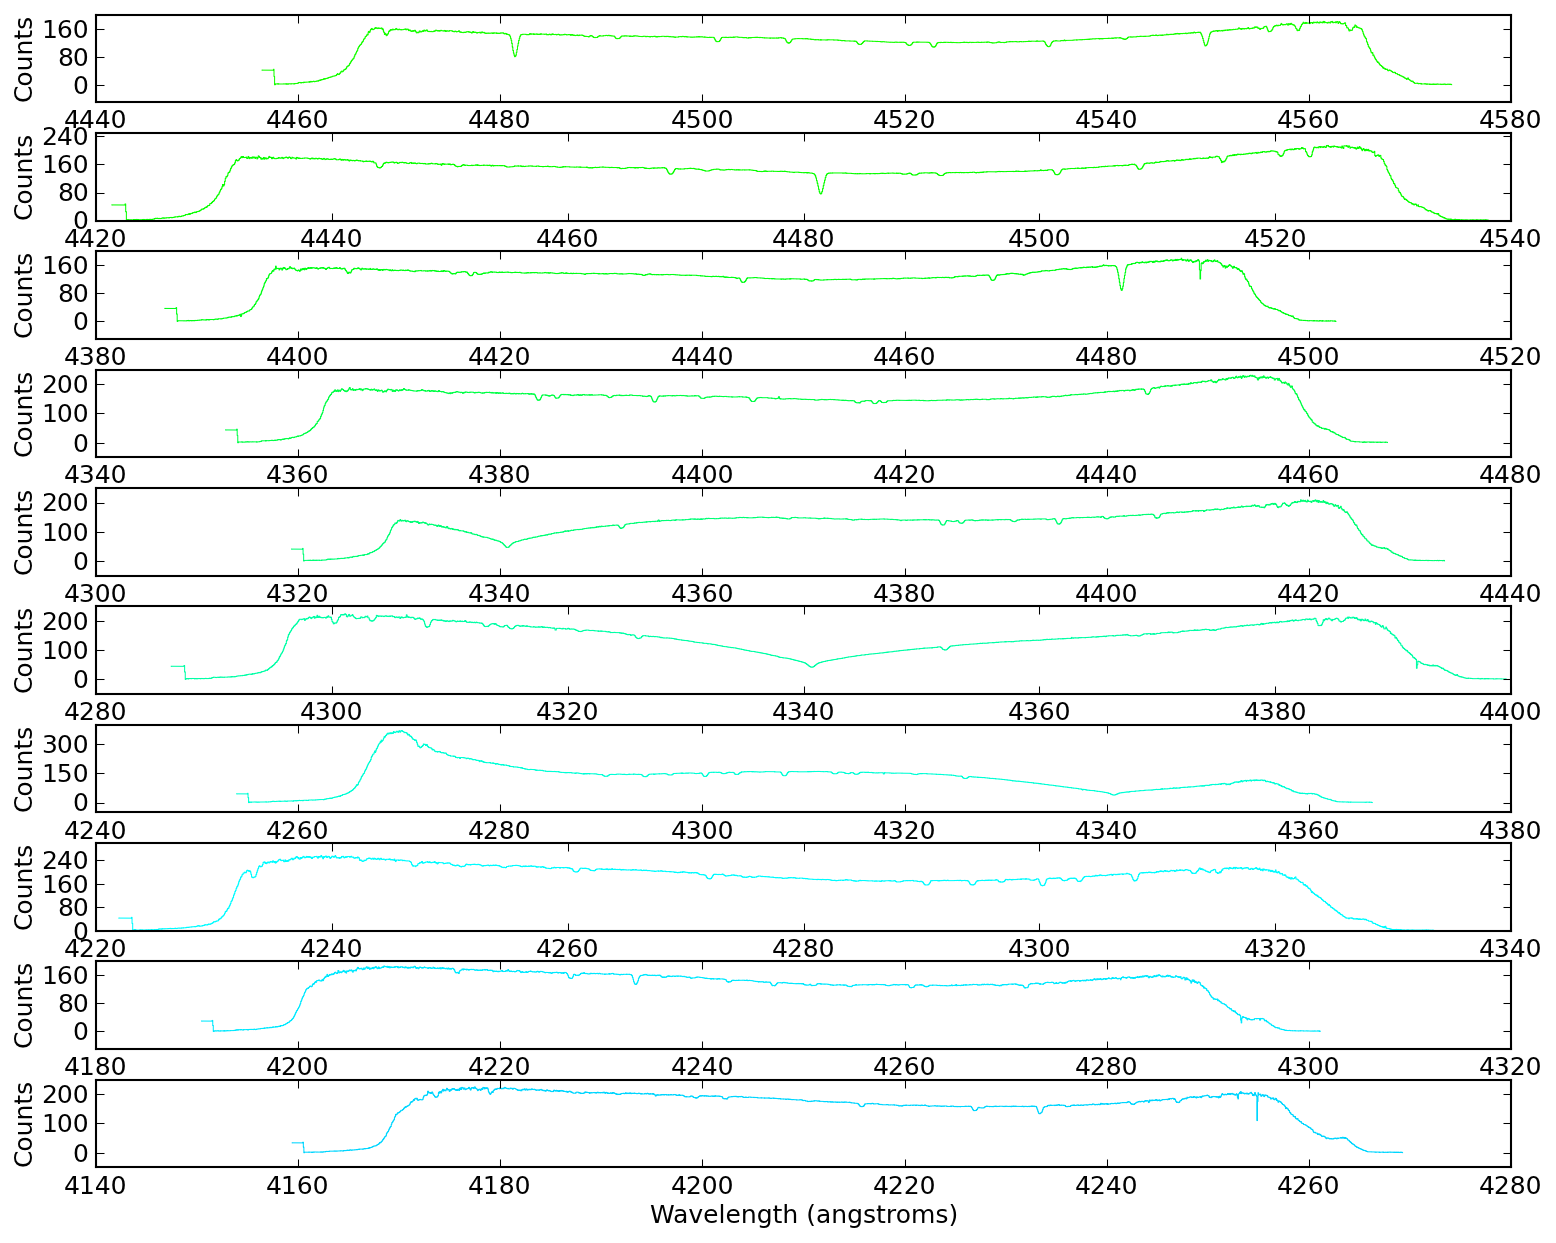
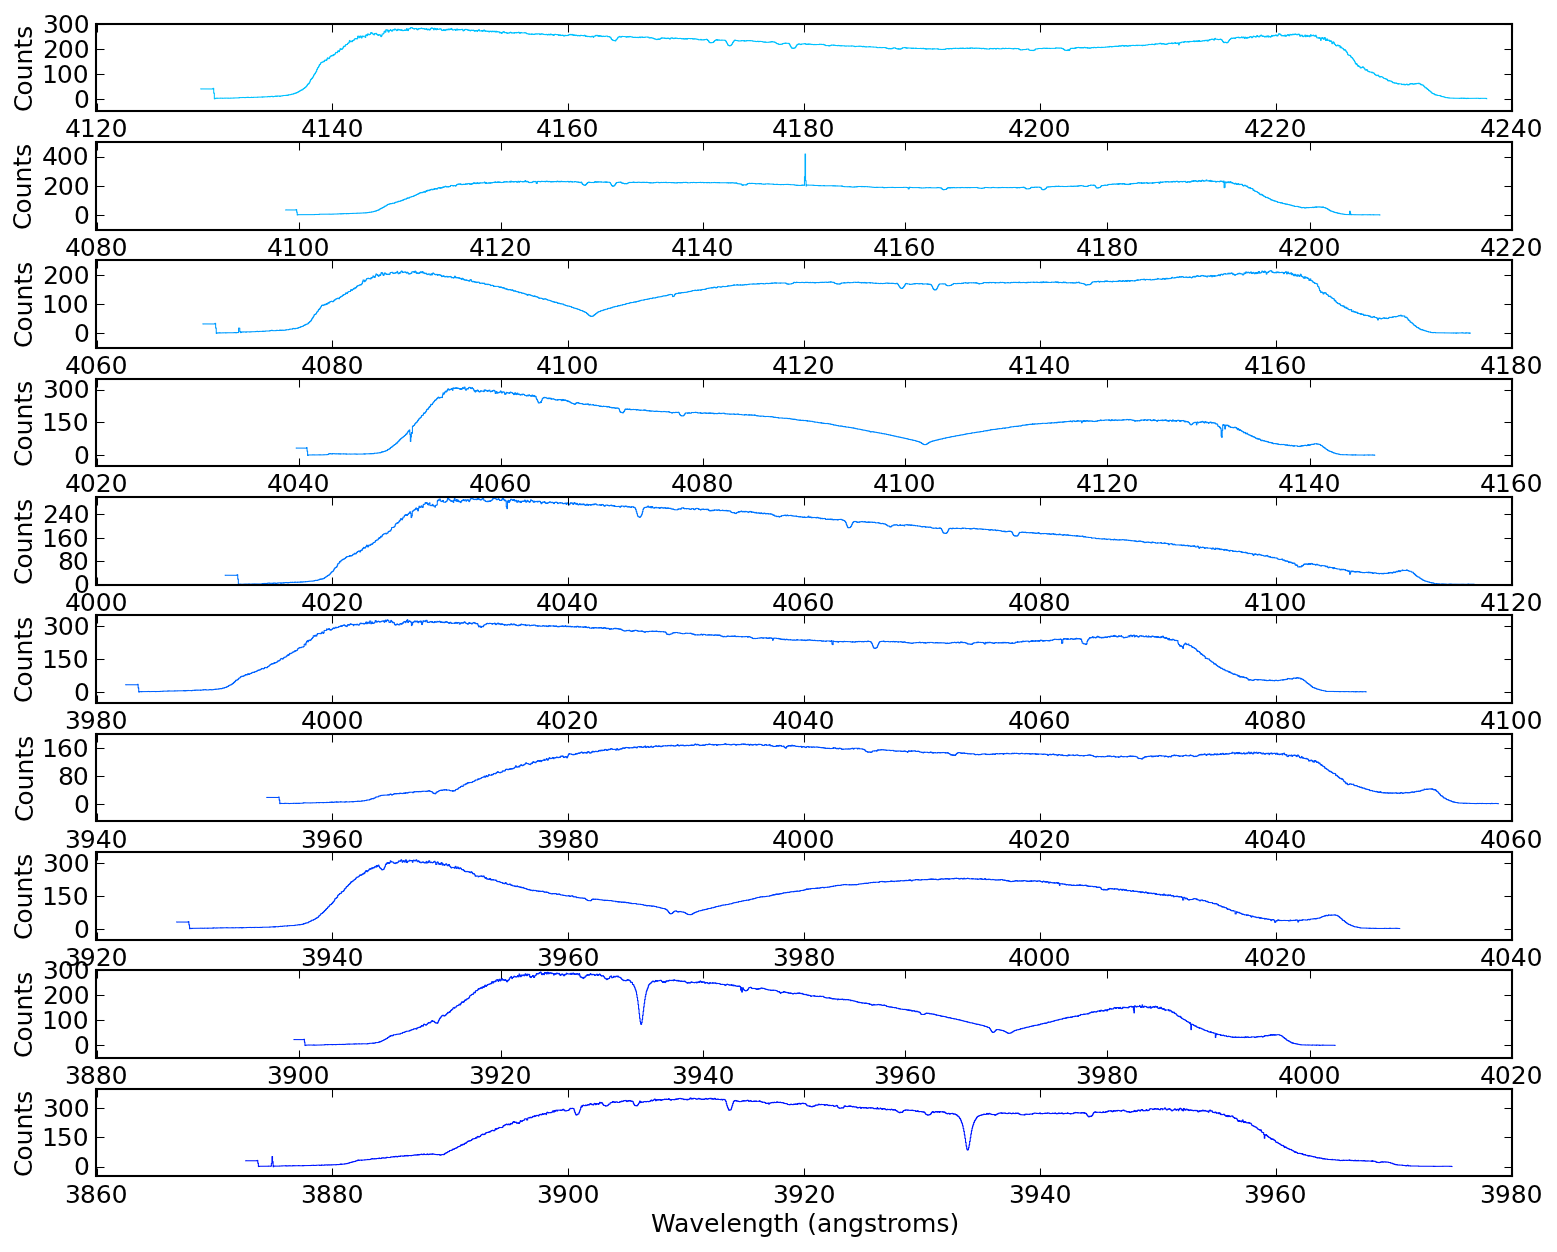
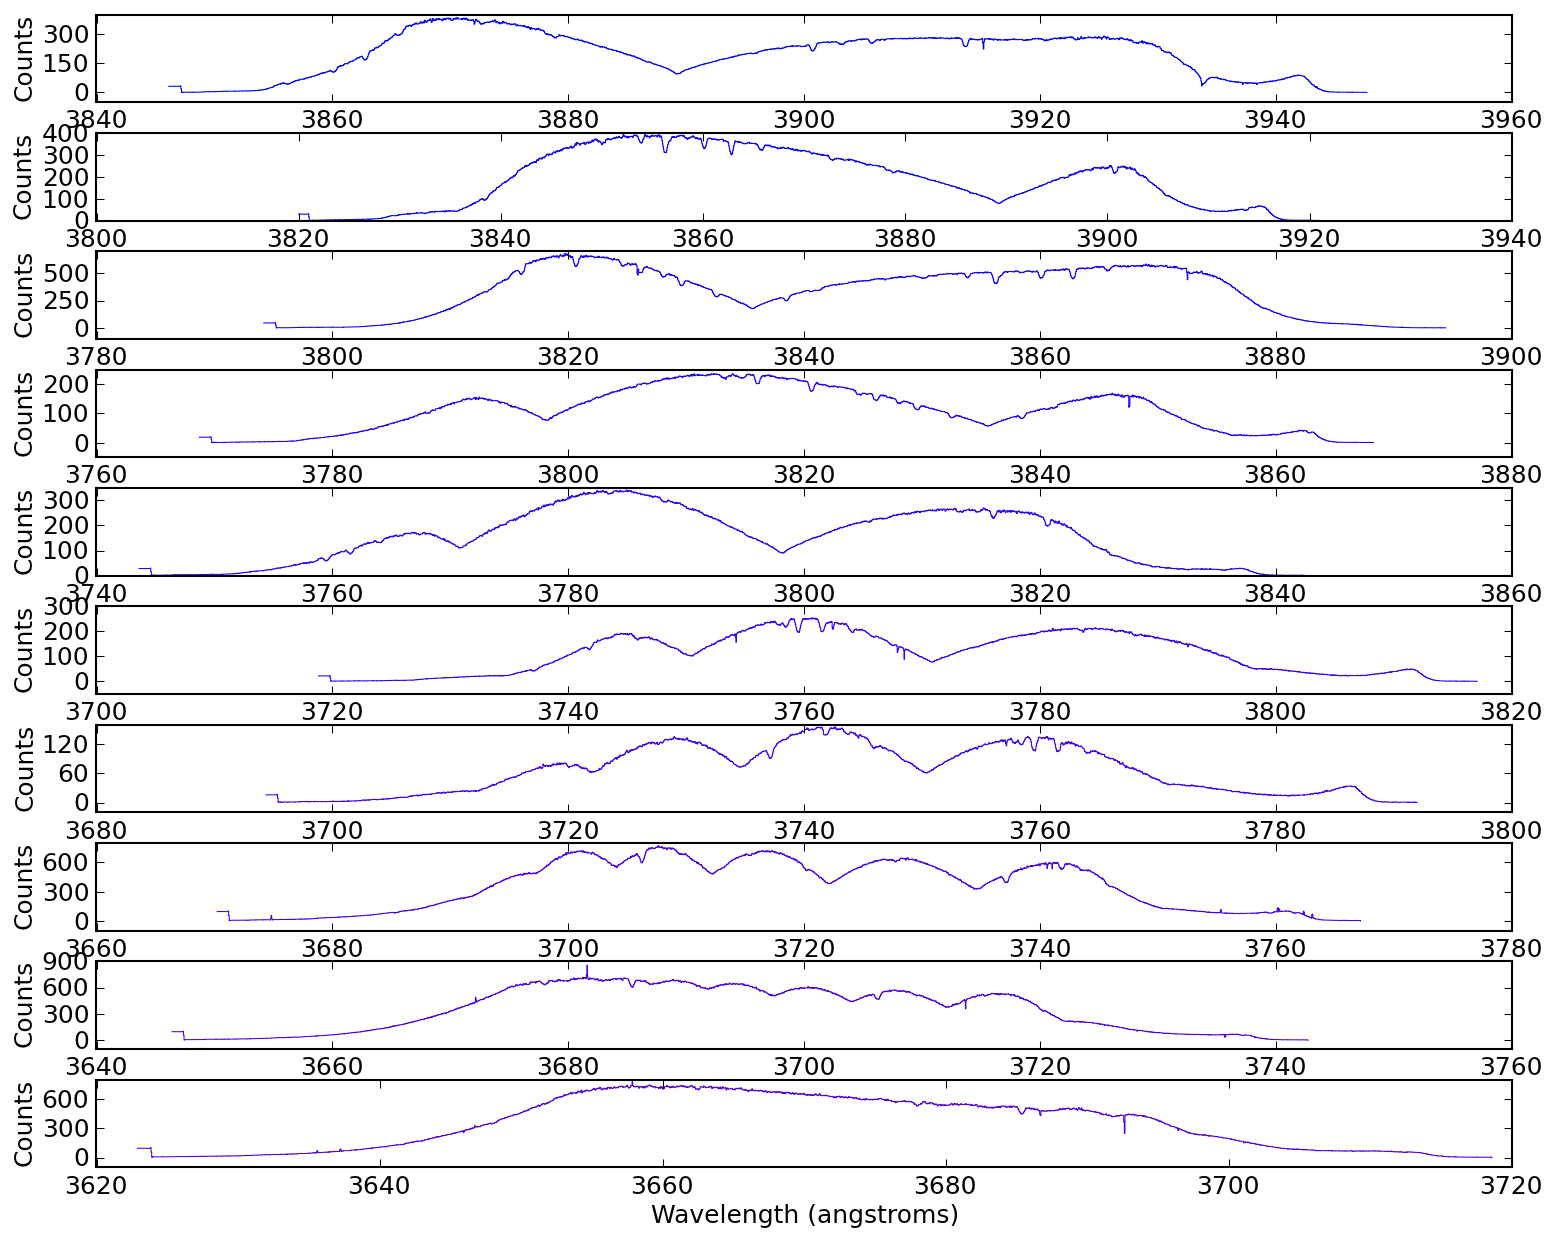
Optical Plotting - Echelle spectrum of Vega (in color!)
import pyspeckit
from pylab import *
if 'wav2rgb' not in globals():
# this is to deal with python3 not being able to execfile
import wav2rgb
if not 'interactive' in globals():
interactive=False
if not 'savedir' in globals():
savedir = ''
speclist = pyspeckit.wrappers.load_IRAF_multispec('evega.0039.rs.ec.dispcor.fits')
for spec in speclist:
spec.unit="Counts"
SP = pyspeckit.Spectra(speclist)
SPa = pyspeckit.Spectra(speclist,xunit='angstrom',quiet=False)
SP.plotter(figure=figure(1))
SPa.plotter(figure=figure(2))
figure(3)
clf()
figure(4)
clf()
#clr = [list(clr) for clr in matplotlib.cm.brg(linspace(0,1,len(speclist)))]
clr = [wav2rgb.wav2RGB(c) + [1.0] for c in linspace(380,780,len(speclist))]
for ii,(color,spec) in enumerate(zip(clr[::-1],speclist)):
spec.plotter(figure=figure(3), clear=False, reset=False, color=color,
refresh=False)
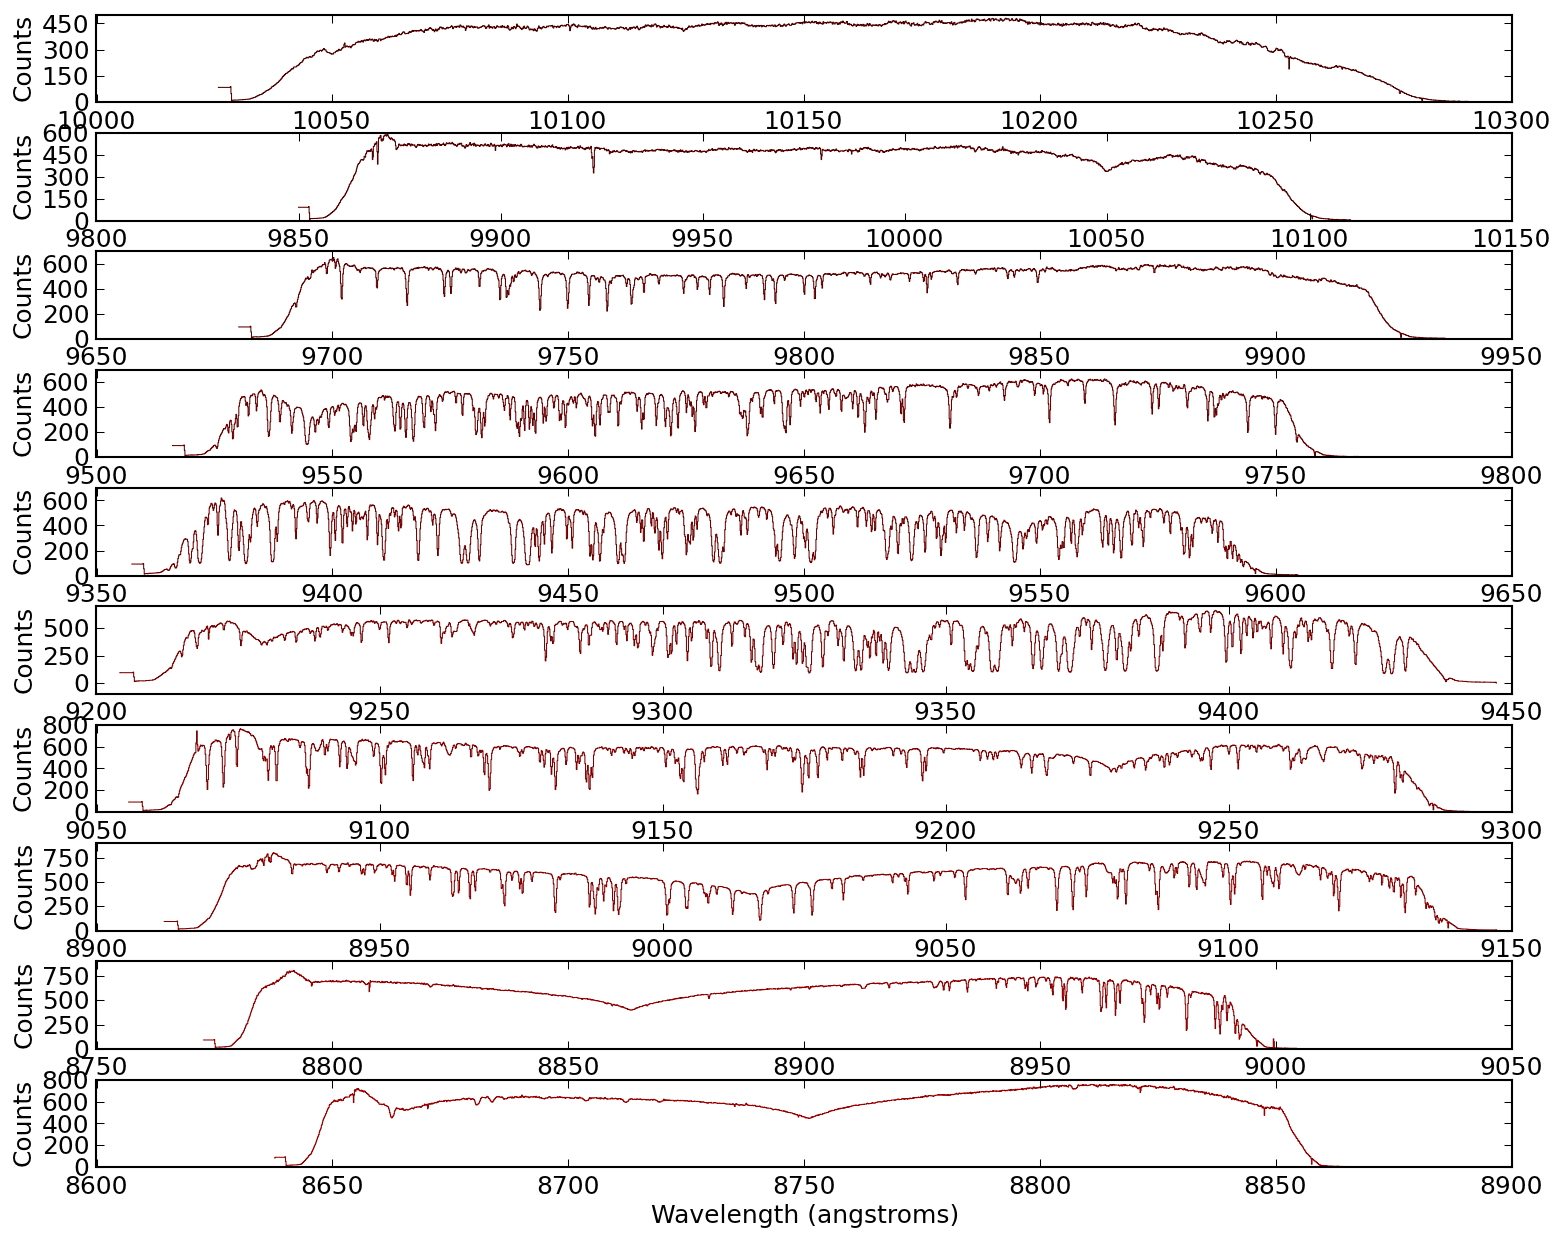
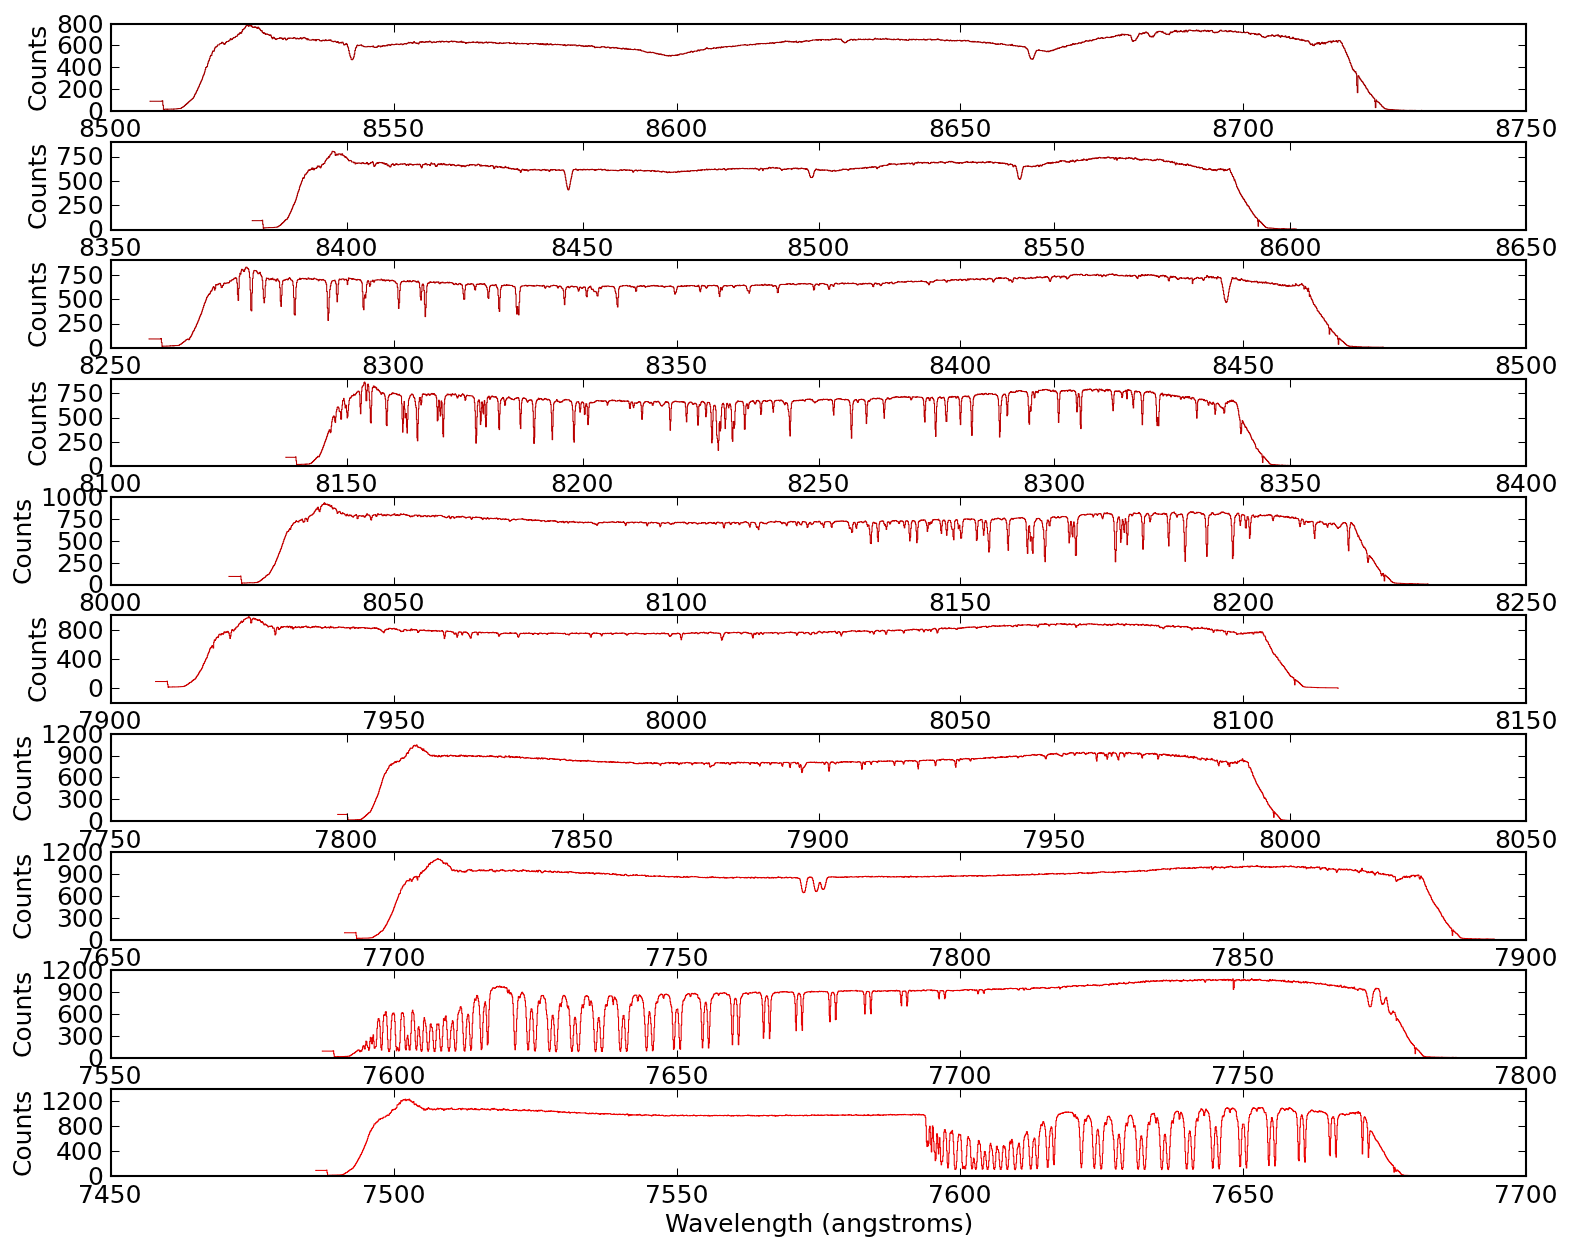
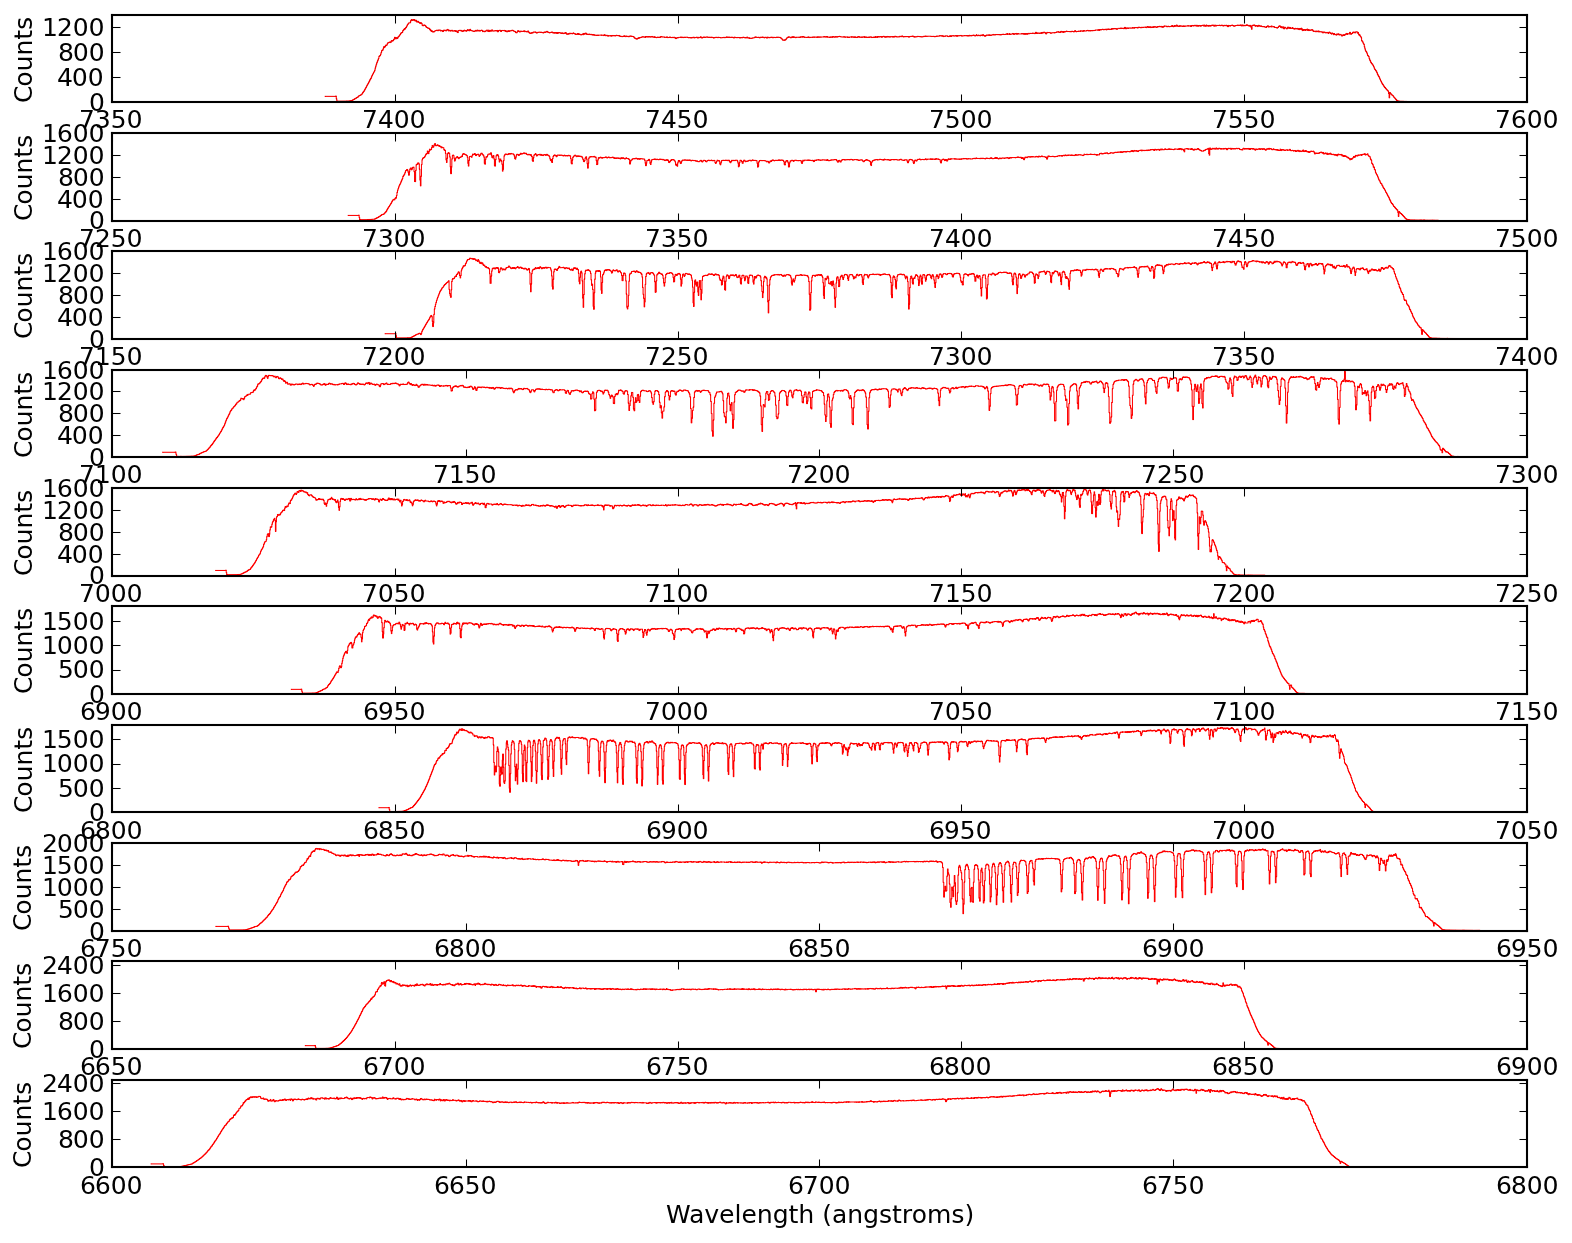
fig4=figure(4)
fig4.subplots_adjust(hspace=0.35,top=0.97,bottom=0.03)
spec.plotter(axis=subplot(10,1,ii%10+1), clear=False, reset=False,
color=color, refresh=False)
spec.plotter.axis.yaxis.set_major_locator(matplotlib.ticker.MaxNLocator(4))
if ii % 10 == 9:
spec.plotter.refresh()
spec.plotter.savefig(savedir+'vega_subplots_%03i.png' % (ii/10+1))
clf()
draw() # refresh all
figure(3)
savefig(savedir+'vega_colorized.png')
#[s.plotter() for s in splist[:5]]
#[s.plotter() for s in speclist[:5]]
#[(subplot(5,1,ii),s.plotter()) for ii,s in enumerate(speclist[:5])]
#[(subplot(5,1,ii),s.plotter()) for ii,s in enumerate(speclist[:5])]
#[(subplot(5,1,ii),s.plotter(axis=subplot(5,1,ii))) for ii,s in enumerate(speclist[:5])]
#[(subplot(5,1,ii),s.plotter(axis=subplot(15,1,ii))) for ii,s in enumerate(speclist[:15])]
#len (speclist)
#subpot
#[(s.plotter(axis=subplot(15,1,ii))) for ii,s in enumerate(speclist[:15])]
#[(s.plotter(axis=subplot(15,1,ii+1))) for ii,s in enumerate(speclist[:15])]
#s.units
#for s in speclist: s.units='counts'
#[(s.plotter(axis=subplot(15,1,ii+1))) for ii,s in enumerate(speclist[:15])]
#savefig('vega_echelle_example.png')
#get_ipython().system(u"open ./")
Modifying and saving echelle orders
load_IRAF_multispec returns a
list of Spectrum objects, one per echelle
order. There is no writer for the IRAF multispec format itself, but each
order can be modified and written out as a standard (linear-wavelength)
1D FITS spectrum with Spectrum.write:
import pyspeckit

orders = pyspeckit.wrappers.load_IRAF_multispec('evega.0039.rs.ec.dispcor.fits')

# modify the flux of each order however you like, e.g.:
for sp in orders:
    sp.data = sp.data * 2

# save each order to its own FITS file
for ii, sp in enumerate(orders):
    sp.write('vega_order{0:03d}.fits'.format(ii), type='fits')

# the saved files are standard 1D spectra; they can be re-loaded with
sp10 = pyspeckit.Spectrum('vega_order010.fits')
By default the error spectrum is written as a second row in the output
file; pass errspecnum=1 to pyspeckit.Spectrum to recover it when
re-loading, or write_error=False to Spectrum.write to write only
the flux.