Radio Fitting: H2CO millimeter thermometer lines
Example hyperfine line fitting of a data cube for the H2CO 303-202, 321-220, and 322-221 lines.
import pyspeckit
try:
import astropy.io.fits as pyfits
except ImportError:
import pyfits
from pyspeckit.spectrum import models
# create the Formaldehyde Radex fitter
# This step cannot be easily generalized: the user needs to read in their own grids
# Some of these grids can be acquired from:
# https://github.com/keflavich/radex_data_grids
texgrid1 = pyfits.getdata('/Users/adam/work/h2co/radex/thermom/303-202_321-220_5kms_temperature_para_tex1.fits')
taugrid1 = pyfits.getdata('/Users/adam/work/h2co/radex/thermom/303-202_321-220_5kms_temperature_para_tau1.fits')
texgrid2 = pyfits.getdata('/Users/adam/work/h2co/radex/thermom/303-202_321-220_5kms_temperature_para_tex2.fits')
taugrid2 = pyfits.getdata('/Users/adam/work/h2co/radex/thermom/303-202_321-220_5kms_temperature_para_tau2.fits')
hdr = pyfits.getheader('/Users/adam/work/h2co/radex/thermom/303-202_321-220_5kms_temperature_para_tau2.fits')
texgrid1b = pyfits.getdata('/Users/adam/work/h2co/radex/thermom/303-202_322-221_5kms_temperature_para_tex1.fits')
taugrid1b = pyfits.getdata('/Users/adam/work/h2co/radex/thermom/303-202_322-221_5kms_temperature_para_tau1.fits')
texgrid2b = pyfits.getdata('/Users/adam/work/h2co/radex/thermom/303-202_322-221_5kms_temperature_para_tex2.fits')
taugrid2b = pyfits.getdata('/Users/adam/work/h2co/radex/thermom/303-202_322-221_5kms_temperature_para_tau2.fits')
hdrb = pyfits.getheader('/Users/adam/work/h2co/radex/thermom/303-202_322-221_5kms_temperature_para_tau2.fits')
# this deserves a lot of explanation:
# models.formaldehyde.formaldehyde_radex is the MODEL that we are going to fit
# models.model.SpectralModel is a wrapper to deal with parinfo, multiple peaks,
# and annotations
# all of the parameters after the first are passed to the model function
# This first one fits only the 303-202 and 322-221 lines
formaldehyde_radex_fitter_b = models.model.SpectralModel(
models.formaldehyde_mm.formaldehyde_mm_radex, 5,
parnames=['temperature','column','density','center','width'],
parvalues=[50,12,4.5,0,1],
parlimited=[(True,True), (True,True), (True,True), (False,False), (True,False)],
parlimits=[(5,205), (10,17), (2,7), (0,0), (0,0)],
parsteps=[0.01,0.01,0.1,0,0],
fitunits='Hz',
texgrid=((218.2,218.3,texgrid1b),(218.4,218.55,texgrid2b)), # specify the frequency range over which the grid is valid (in GHz)
taugrid=((218.2,218.3,taugrid1b),(218.4,218.55,taugrid2b)),
hdr=hdrb,
shortvarnames=("T","N","n","v","\\sigma"), # specify the parameter names (TeX is OK)
grid_vwidth=5.0,
)
# This second fitter fits only the 303-202 and 321-220 lines
formaldehyde_radex_fitter = models.model.SpectralModel(
models.formaldehyde_mm.formaldehyde_mm_radex, 5,
parnames=['temperature','column','density','center','width'],
parvalues=[50,12,4.5,0,1],
parlimited=[(True,True), (True,True), (True,True), (False,False), (True,False)],
parlimits=[(5,205), (10,17), (2,7), (0,0), (0,0)],
parsteps=[0.01,0.01,0.1,0,0],
fitunits='Hz',
texgrid=((218.2,218.3,texgrid1),(218.7,218.8,texgrid2)), # specify the frequency range over which the grid is valid (in GHz)
taugrid=((218.2,218.3,taugrid1),(218.7,218.8,taugrid2)),
hdr=hdr,
shortvarnames=("T","N","n","v","\\sigma"), # specify the parameter names (TeX is OK)
grid_vwidth=5.0,
)
# This third fitter fits all three of the 303-202, 322-221, and 321-220 lines
# Since it has no additional free parameters, it's probably best...
formaldehyde_radex_fitter_both = models.model.SpectralModel(
models.formaldehyde_mm.formaldehyde_mm_radex, 5,
parnames=['temperature','column','density','center','width'],
parvalues=[50,12,4.5,0,1],
parlimited=[(True,True), (True,True), (True,True), (False,False), (True,False)],
parlimits=[(5,205), (10,17), (2,7), (0,0), (0,0)],
parsteps=[0.01,0.01,0.1,0,0],
fitunits='Hz',
texgrid=((218.2,218.3,texgrid1b),(218.4,218.55,texgrid2b),(218.7,218.8,texgrid2)), # specify the frequency range over which the grid is valid (in GHz)
taugrid=((218.2,218.3,taugrid1b),(218.4,218.55,taugrid2b),(218.7,218.8,taugrid2)),
hdr=hdrb,
shortvarnames=("T","N","n","v","\\sigma"), # specify the parameter names (TeX is OK)
grid_vwidth=5.0,
)
if __name__ == "__main__":
import pyspeckit.spectrum.readers.read_class
sp = pyspeckit.readers.read_class.class_to_spectra('example_h2co_mm_spectrum.apex')
sp.data *= 1/0.75 # T_A* -> T_MB
sp.unit = "$T_{MB}$"
# estimate the error from the data
sp.error[:] = sp.stats((2.183e2,2.184e2))['std']
# register the fitters
sp.Registry.add_fitter('formaldehyde_mm_radex',
formaldehyde_radex_fitter,5)
sp.Registry.add_fitter('formaldehyde_mm_radex_b',
formaldehyde_radex_fitter_b,5)
sp.Registry.add_fitter('formaldehyde_mm_radex_both',
formaldehyde_radex_fitter_both,5)
# make 3 copies so that we can view independent fits
# This step isn't really necessary, but it's a nice way to compare the fits
# side-by-side
sp1 = sp.copy()
sp2 = sp.copy()
sp3 = sp.copy()
sp1.plotter(figure=1)
sp1.specfit(fittype='formaldehyde_mm_radex',
multifit=None,
guesses=[100,13.2,4.5,0,7.0],
limits=[(20,200),(11,15),(3,5.5),(-5,5),(2,15)],
limited=[(True,True)]*5,
fixed=[False,False,True,False,False],
quiet=False,)
sp1.plotter.savefig('h2co_mm_fit_303-202_321-220.png')
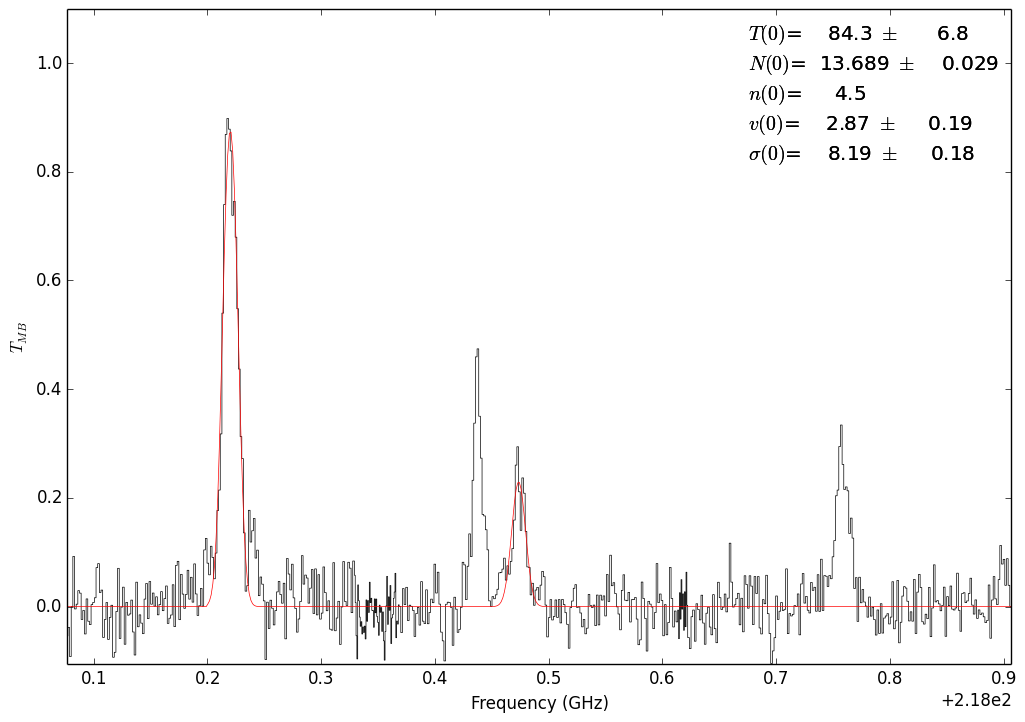
sp2.plotter(figure=2)
sp2.specfit(fittype='formaldehyde_mm_radex_b',
multifit=None,
guesses=[100,13.2,4.5,0,7.0],
limits=[(20,200),(11,15),(3,5.5),(-5,5),(2,15)],
limited=[(True,True)]*5,
fixed=[False,False,True,False,False],
quiet=False,)
sp2.plotter.savefig('h2co_mm_fit_303-202_322-221.png')
# Do two versions of the fit with different input guesses
sp3.plotter(figure=3)
sp3.specfit(fittype='formaldehyde_mm_radex_both',
multifit=None,
guesses=[95,13.2,4.5,0,7.0],
limits=[(20,200),(11,15),(3,5.5),(-5,5),(2,15)],
limited=[(True,True)]*5,
fixed=[True,False,False,False,False],
quiet=False,)
sp3.plotter.savefig('h2co_mm_fit_303-202_322-221_and_303-202_321-220_try1.png')
sp3.plotter(figure=4)
sp3.specfit(fittype='formaldehyde_mm_radex_both',
multifit=None,
guesses=[105,13.2,4.5,0,7.0],
limits=[(20,200),(11,15),(3,5.5),(-5,5),(2,15)],
limited=[(True,True)]*5,
fixed=[False,True,False,False,False],
quiet=False,)
sp3.plotter.savefig('h2co_mm_fit_303-202_322-221_and_303-202_321-220_try2.png')
# An illustration of the degeneracy between parameters
sp3.plotter(figure=5)
sp3.specfit.plot_model([95,13.5,4.75,2.89,6.85])
sp3.specfit.plot_model([165,13.5,7.0,2.89,6.85],composite_fit_color='b')
sp3.specfit.plot_model([117,13.15,5.25,2.89,6.85],composite_fit_color='g')
sp3.plotter.savefig("h2co_mm_fit_degeneracy_example.png")
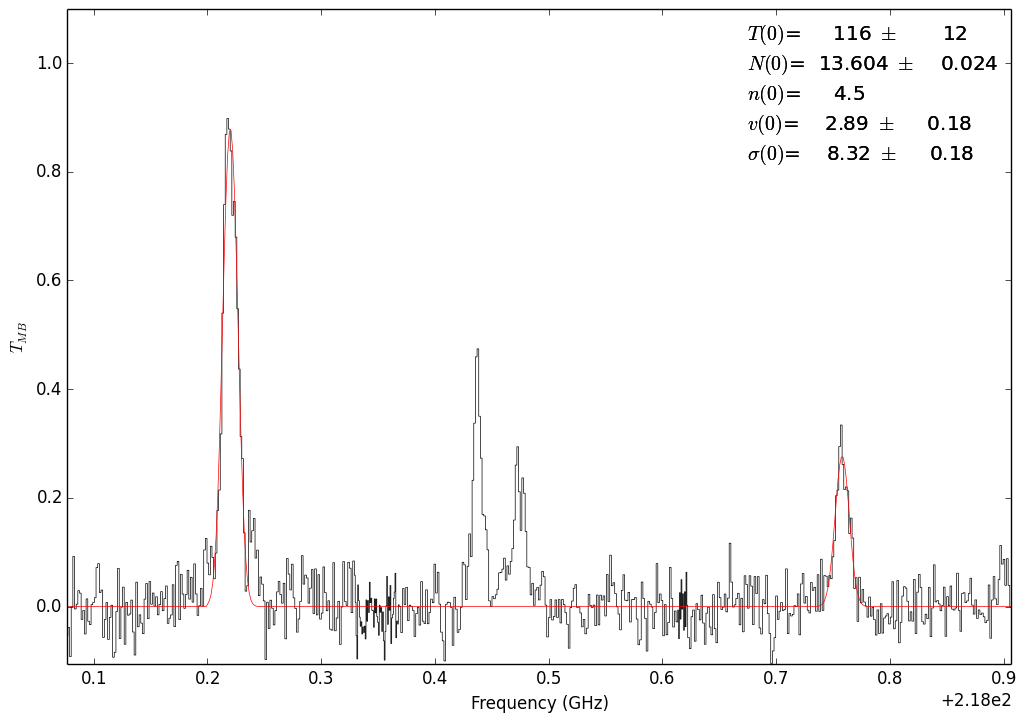
Fit with the 302-202 and 321-220 lines
Fit with the 302-202 and 321-220 lines
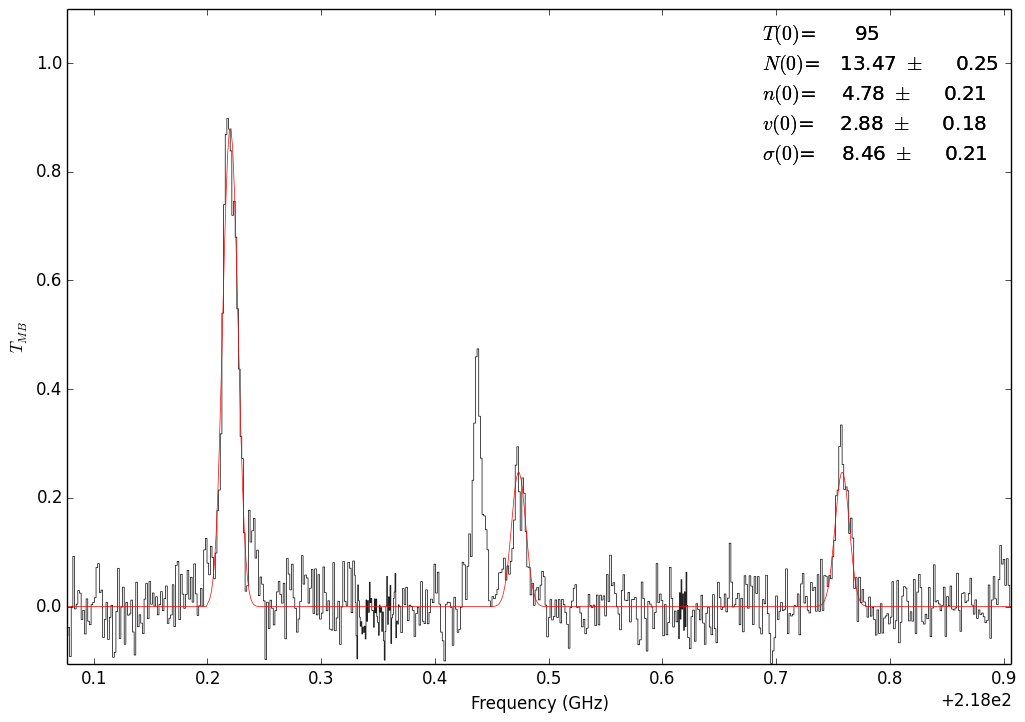
Fit with all 3 lines. In this case, the temperature is unconstrained.

Fit with all 3 lines. In this case, the column is unconstrained.
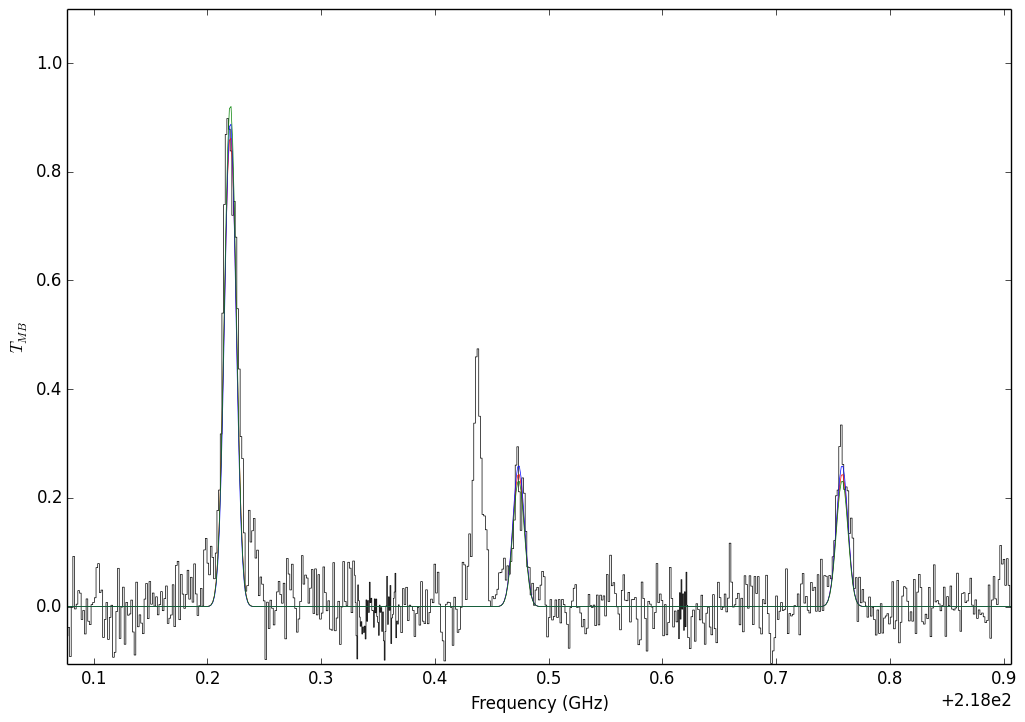
A demonstration of degenerate parameters. The parameters used are:
Blue: T,N,n = 95, 13.5, 4.75
Green: T,N,n = 165, 13.5, 7.0
Red: T,N,n = 117, 13.15, 5.25