A guide to interactive fitting
A step-by-step example of how to use the interactive fitter.
In short, we will do the following:
# 1. Load the spectrum
sp = pyspeckit.Spectrum('hr2421.fit')
# 2. Plot a particular spectral line
sp.plotter(xmin=4700,xmax=5000)
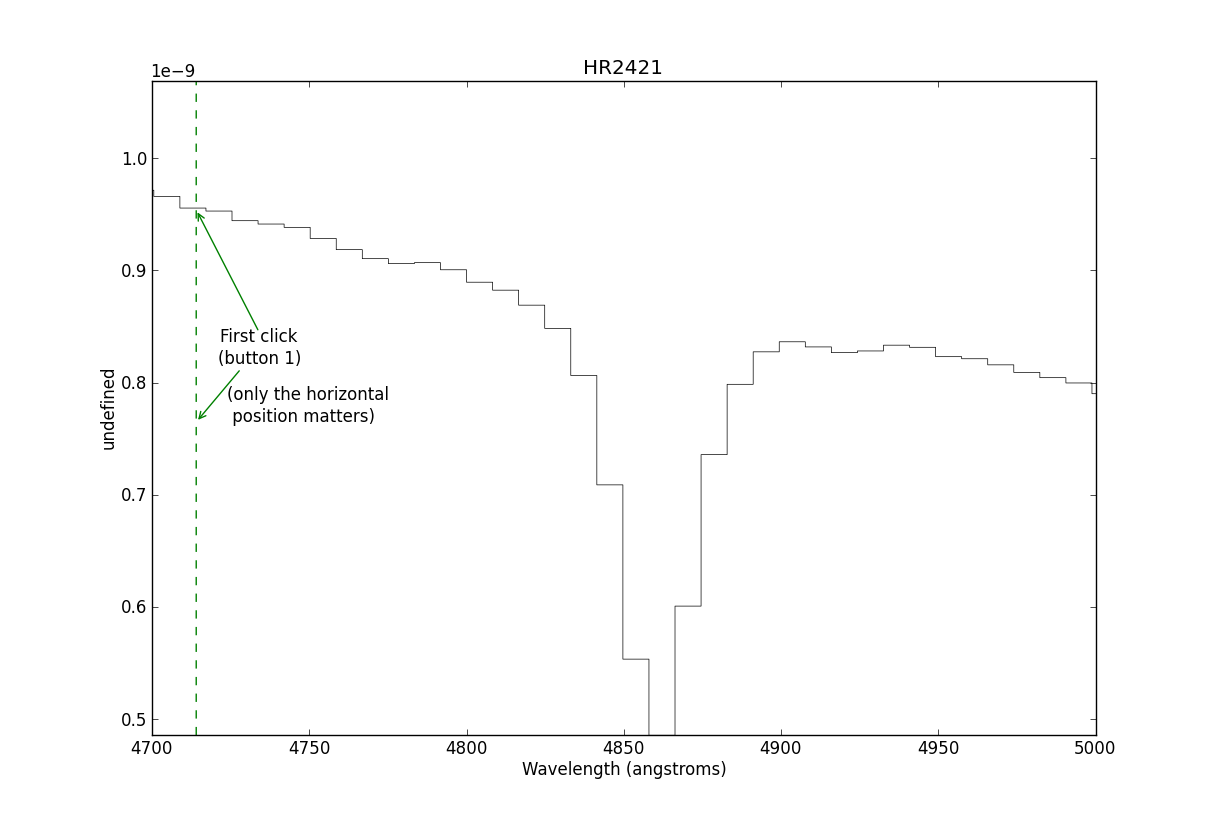
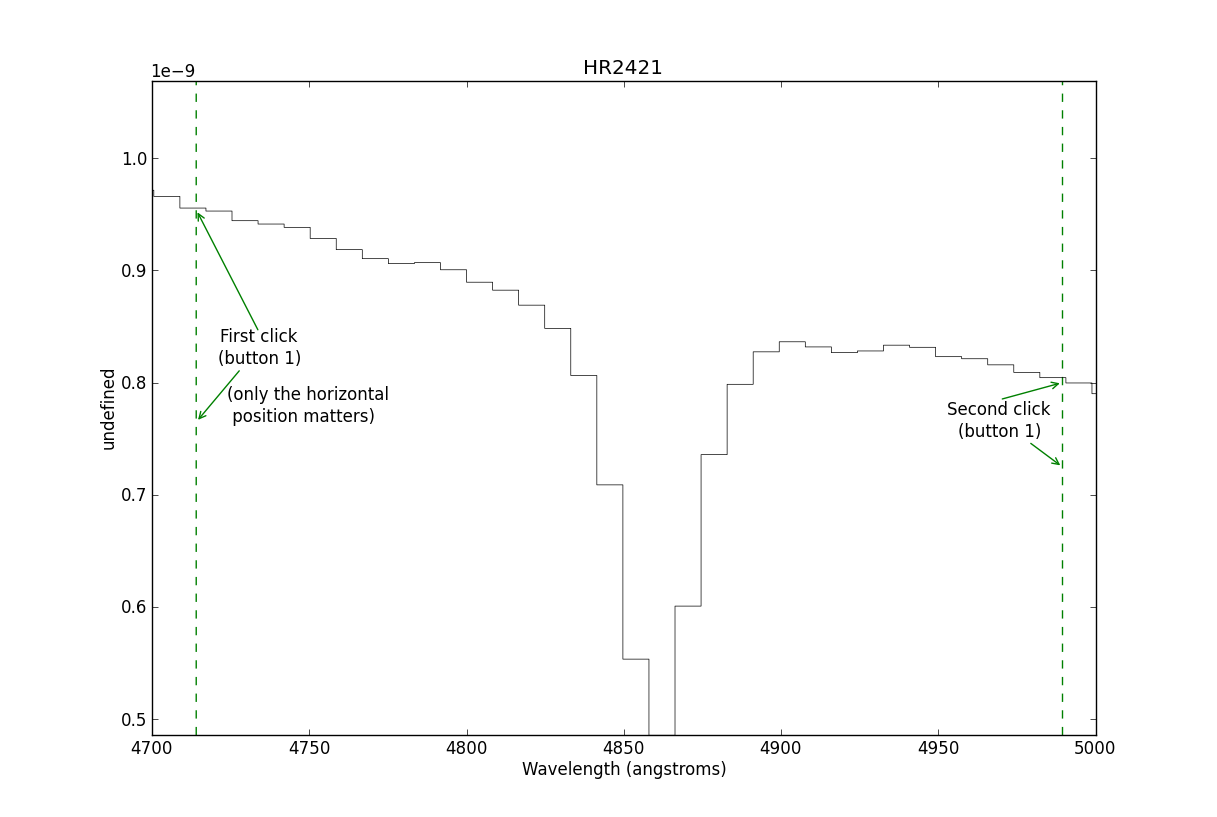
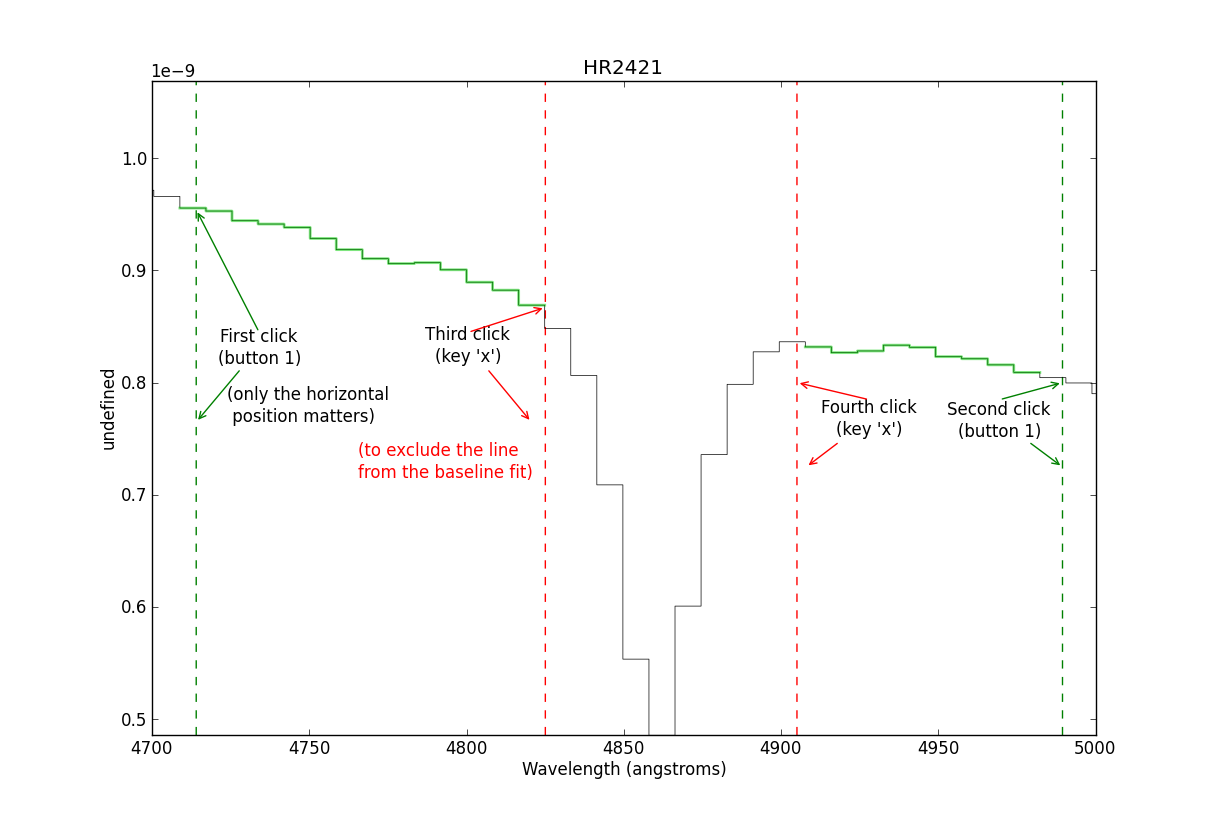
# 3. Need to fit the continuum first
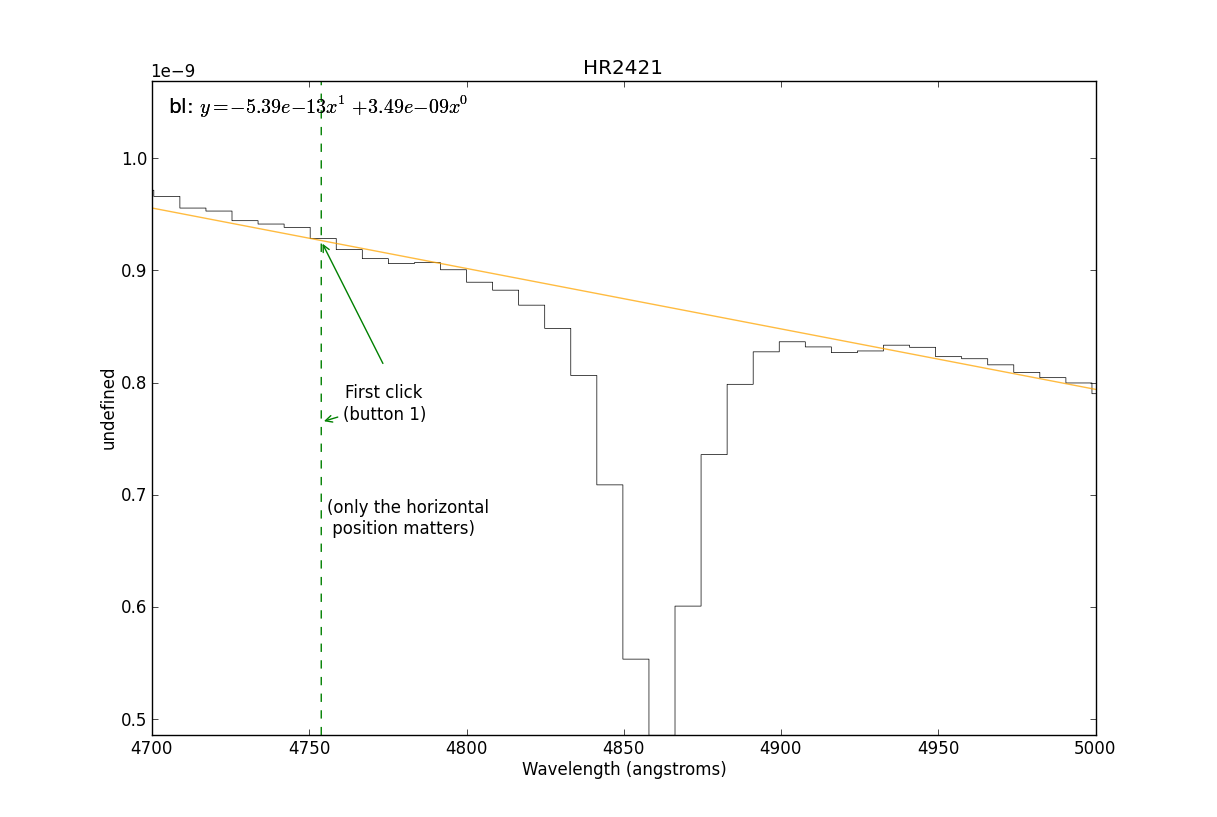
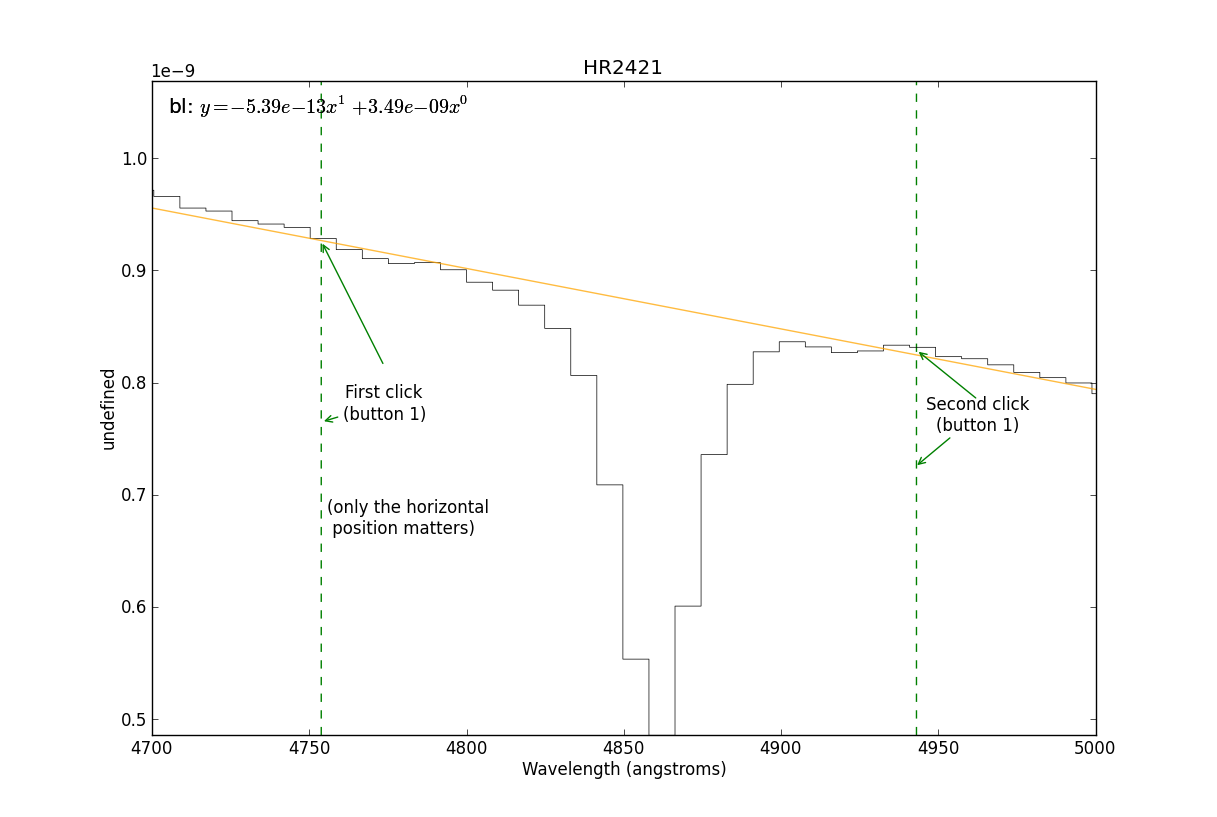
sp.baseline(interactive=True, subtract=False)
# DO INTERACTIVE THINGS HERE
# 4... (much work takes place interactively at this stage)
# 5. Start up an interactive line-fitting session
# (do not run this line until *after* completing the baseline fitting)
#sp.specfit(interactive=True)
Note
If you don’t see a plot window after step #2 above, make sure you’re using
matplotlib in interactive mode. This may require starting ipython as
ipython --pylab
You can also start the interactive fitter by pressing ‘b’ for baseline or ‘f’ for fit when a plot window is active, then press ‘?’ to get help. These commands will not work if you have the “zoom” or “pan” tools active, though!
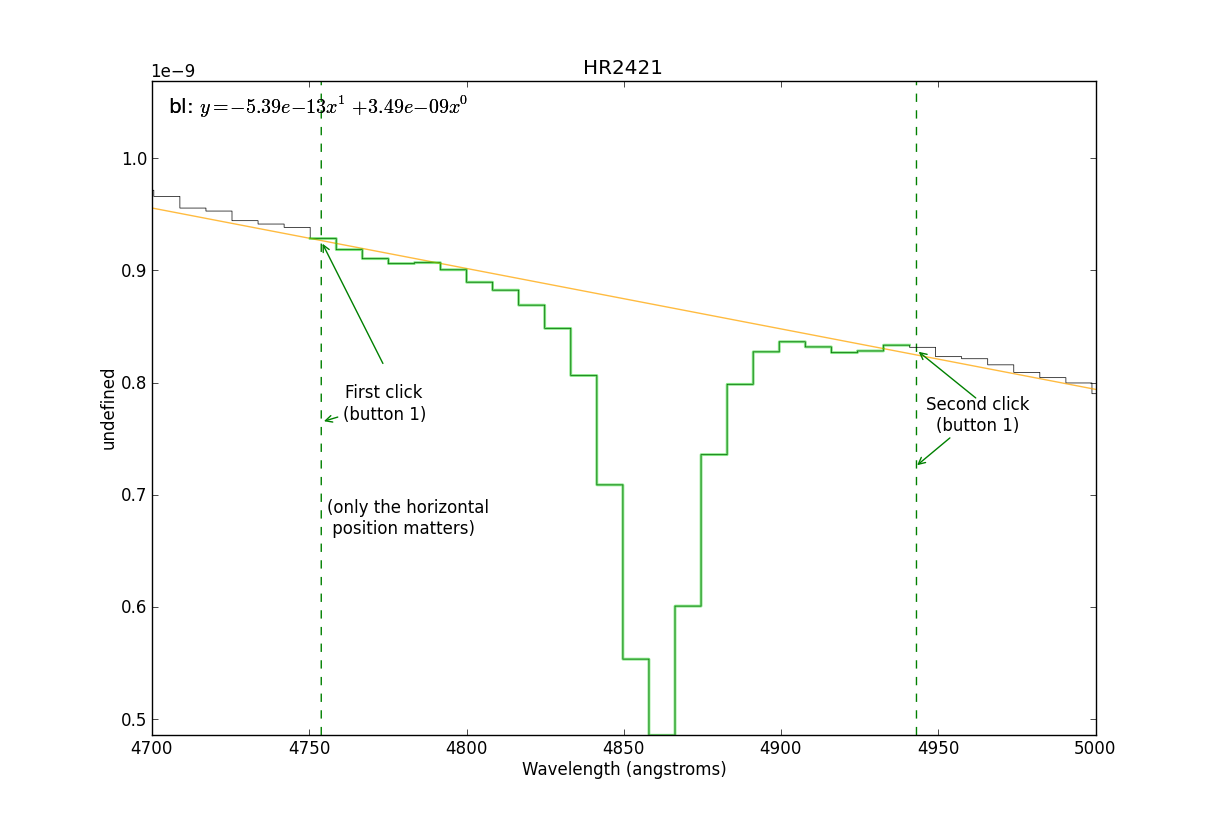
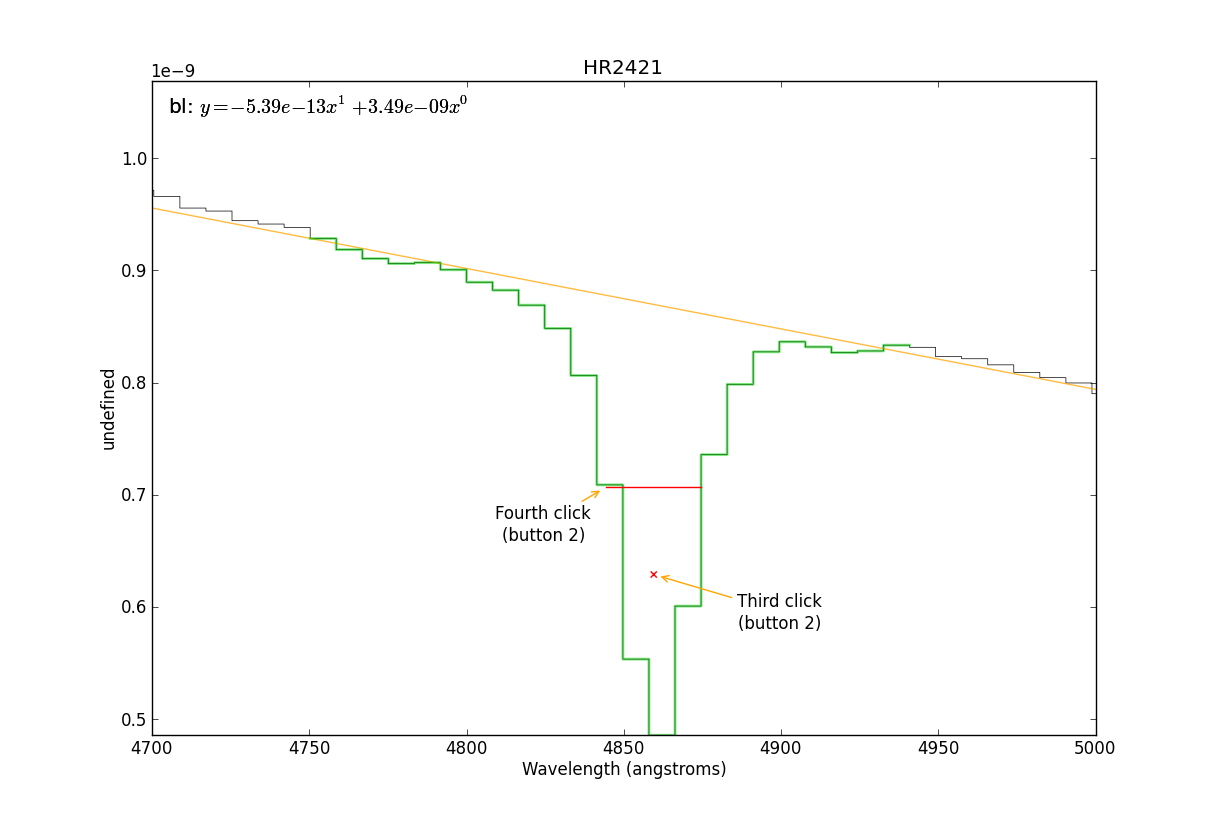
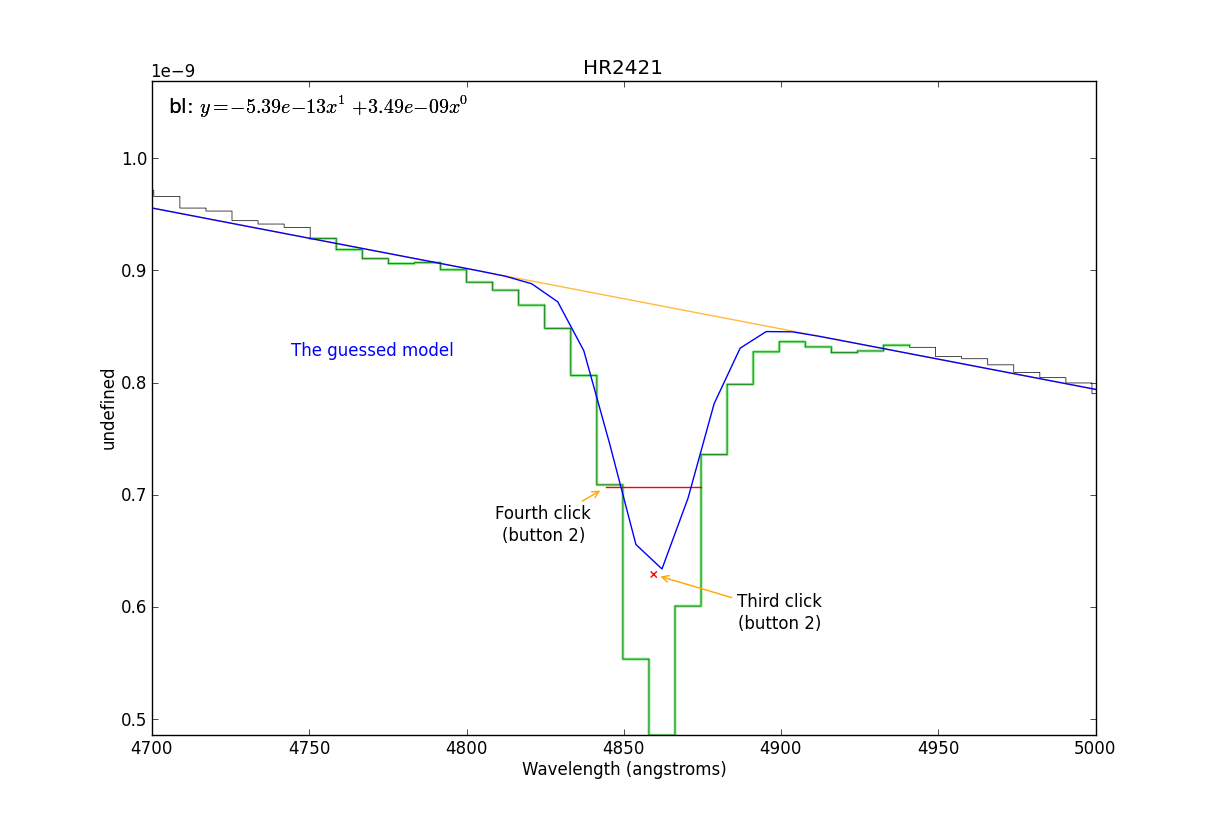
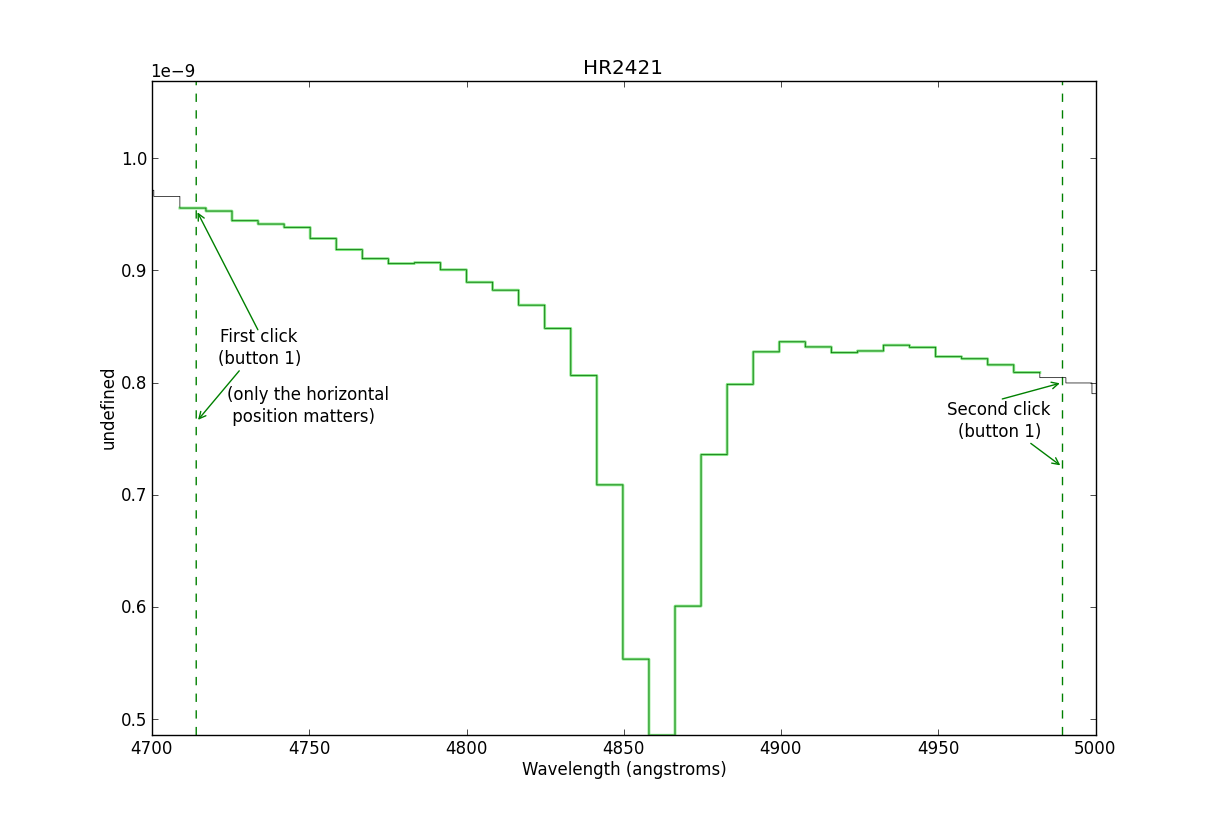
The interactive mode accepts both mouse clicks and keystrokes (the figure captions below say “click”, but every action has a keyboard equivalent):
left-click, or press
p,i, ora: select the edges of a region. The first two selections set the fitting region; when fitting lines, subsequent pairs of selections mark each line’s peak and width.press
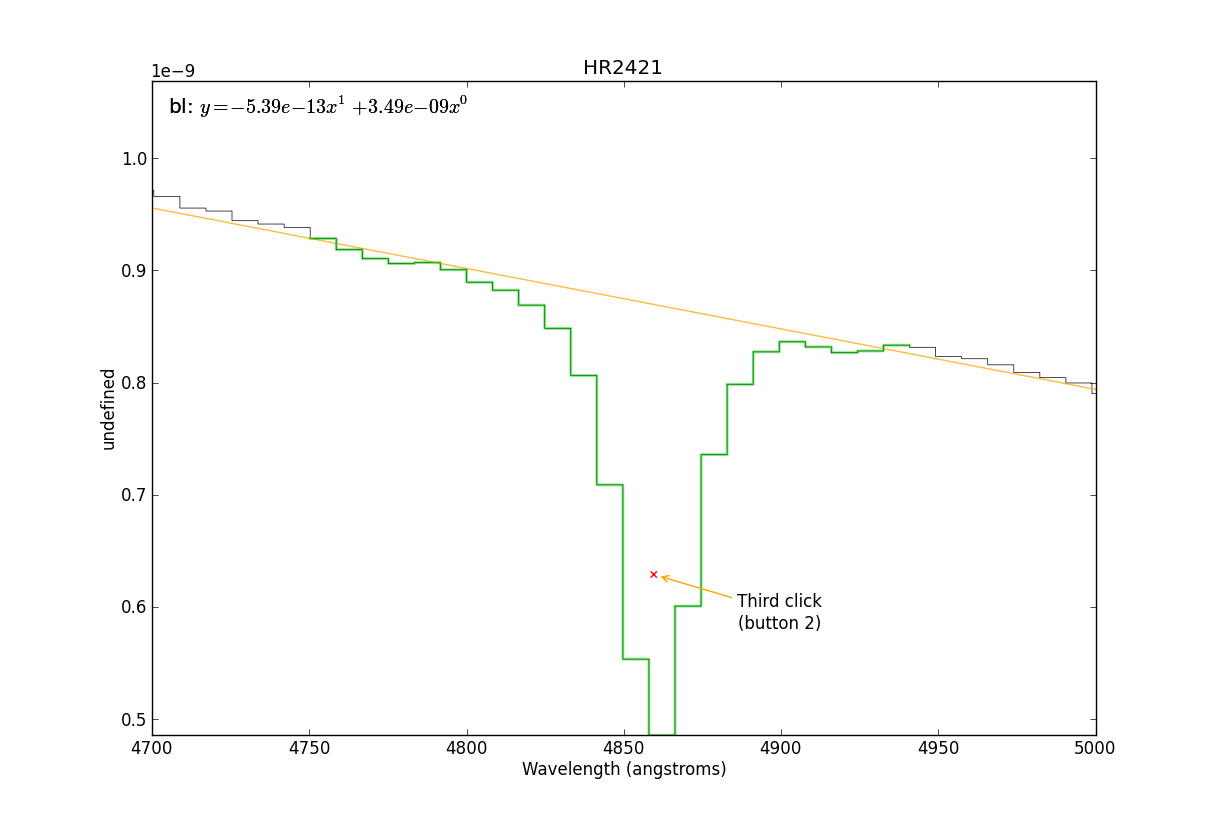
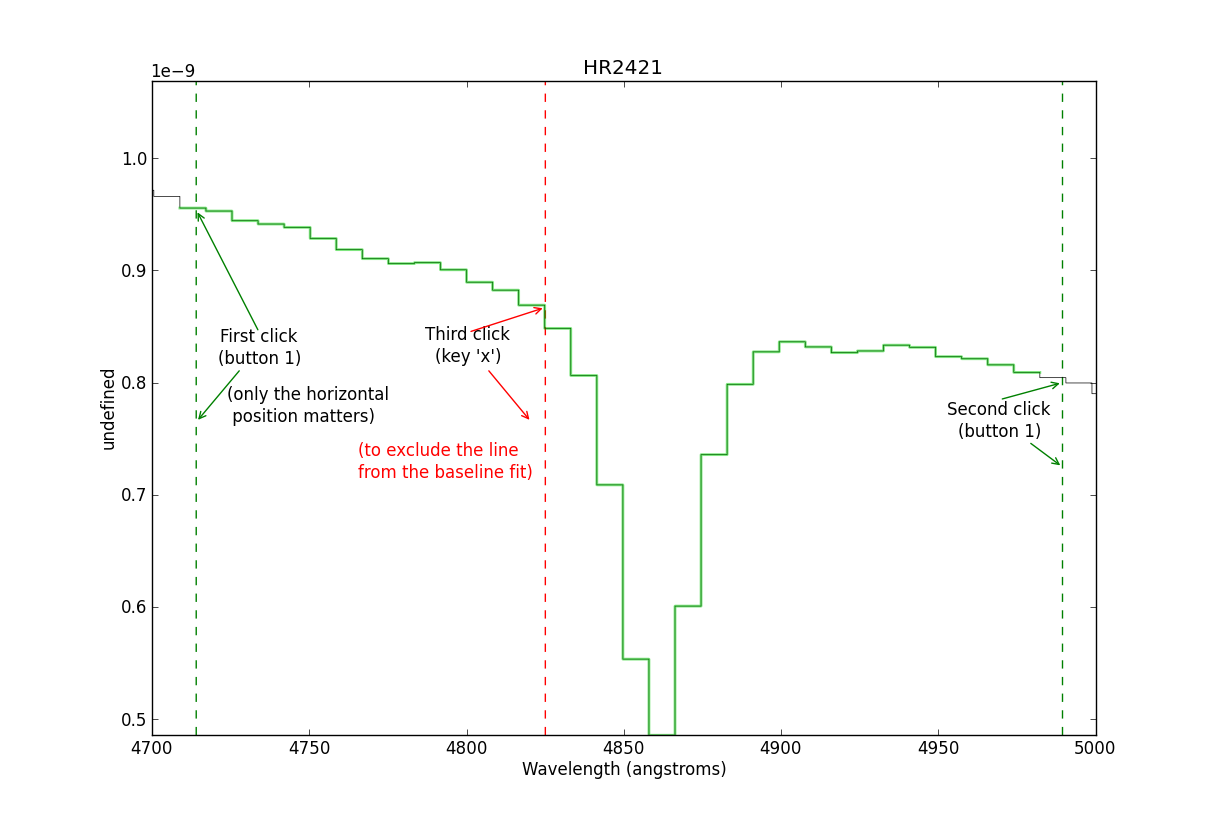
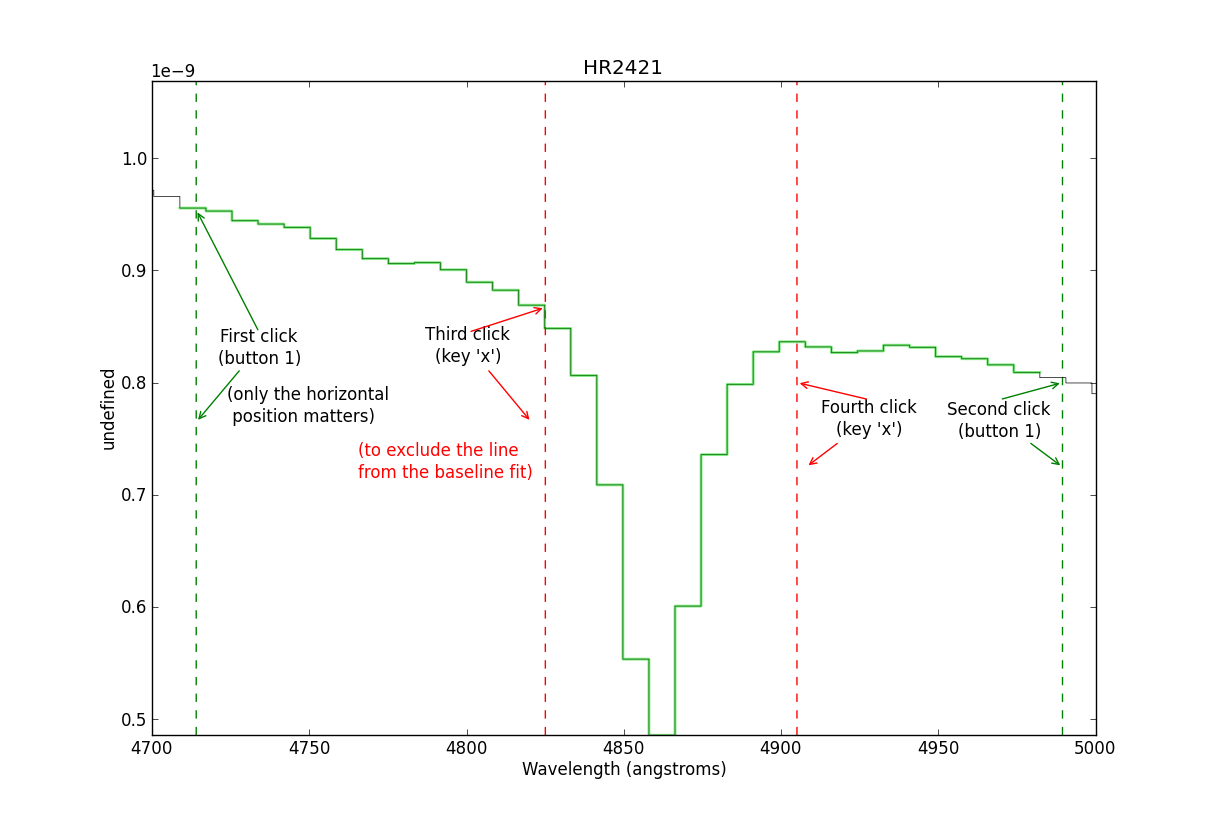
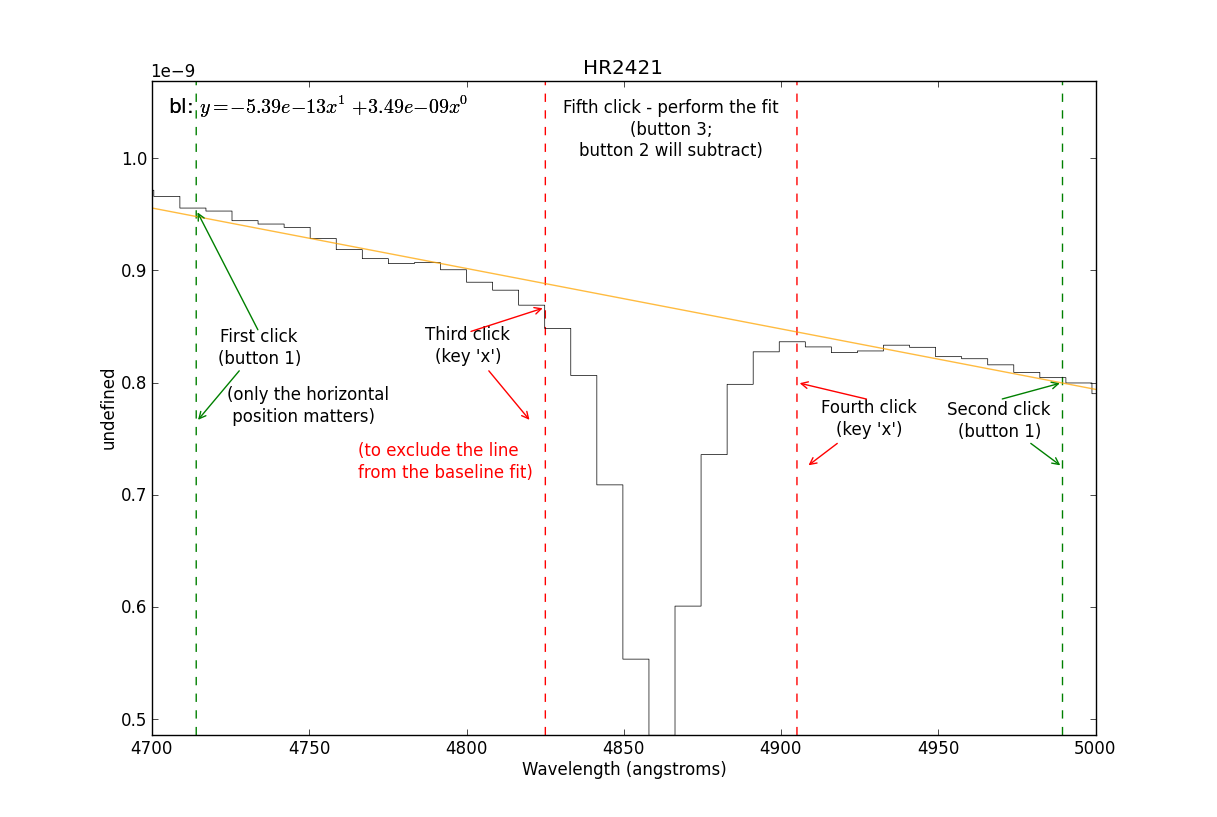
xore: exclude the region between the next two selections (baseline mode).right-click, or press
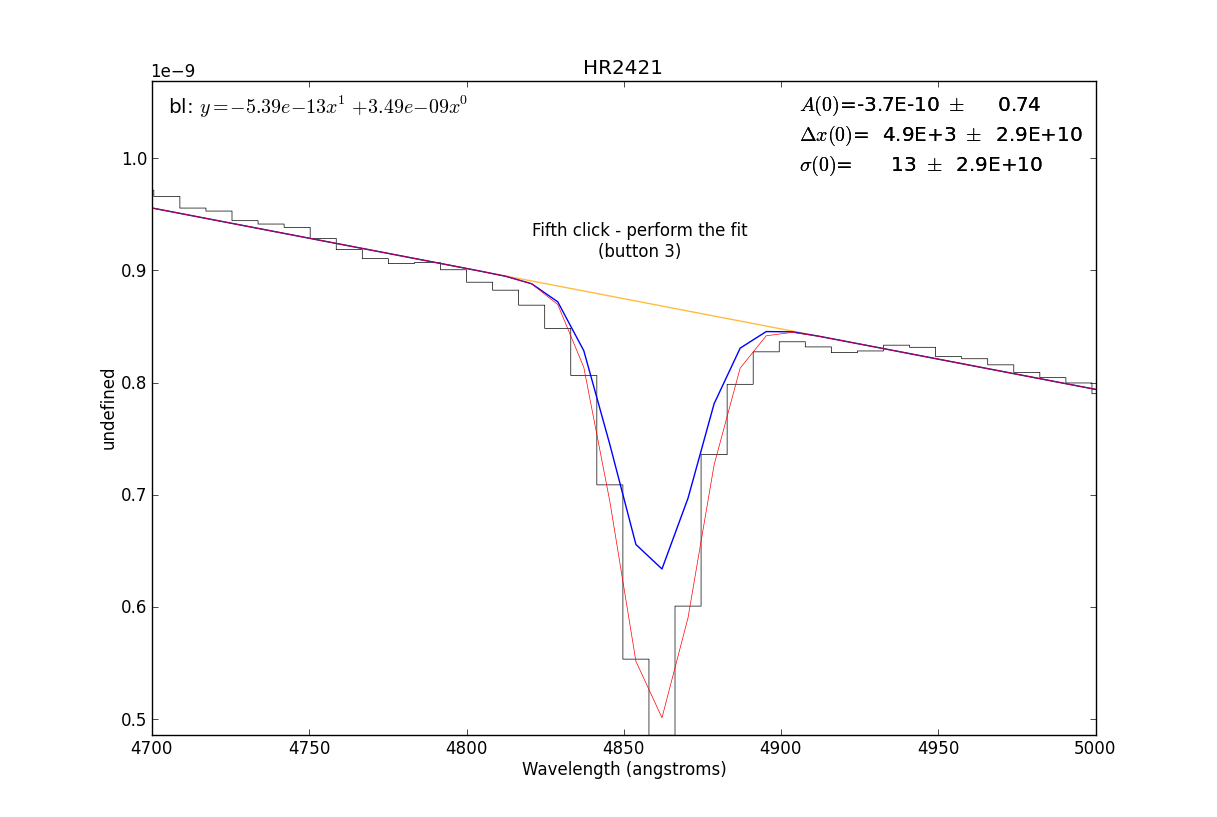
d: done – perform the fit.press
?: print the interactive-mode help to the terminal.
This is where you start the line-fitter:
# Start up an interactive line-fitting session
sp.specfit(interactive=True)